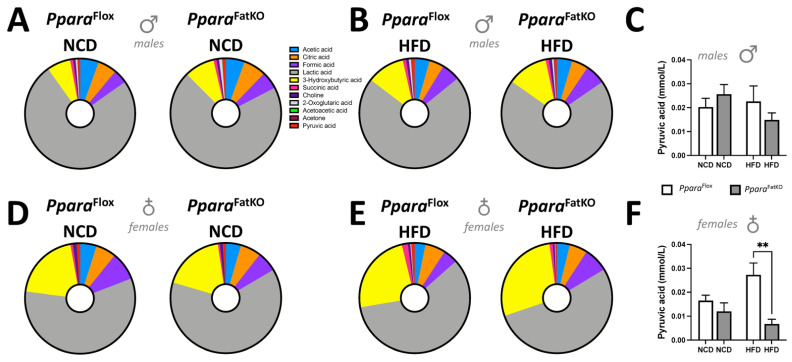
Figure 4.
Plasma metabolites in PparaFatKO and Pparafl/fl mice fed high-fat or normal-chow diets. Pie and bar graphs of plasma amino acids in male (A–C) and female (D–F) PparaFatKO and Pparafl/fl mice on high-fat (HFD) or normal-chow (NCD) diets. **, p < 0.01 (vs. Pparafl/fl HFD) (male n = 8 NCD and n = 7 HFD, Pparafl/fl; female n = 6 NCD and n = 4 HFD, Pparafl/fl; male n = 8 NCD and n = 8 HFD, PparaHepKO; female n = 6 NCD and n = 4 HFD, PparaHepKO).

