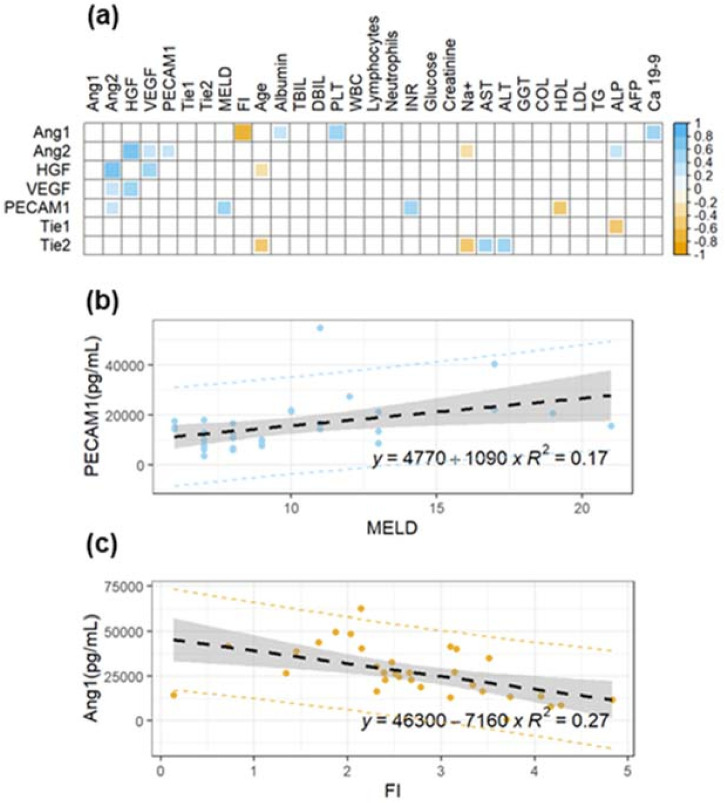
Figure 3.
(a) Correlation matrix of Spearman’s coefficients, ρ, between the investigated angiogenesis markers and a panel of selected plasma biochemical parameters and clinical scores in a cohort of HCC patients. A double color scale is used to assess the direction of the correlations, with negative values displayed in orange and positive ones in light blue. The strength of the significant correlation is directly proportional to the pixel size and the pixel intensity. Non-significant correlations are indicated as empty white pixels. (b) Linear regression analysis of PECAM-1 as a function of MELD for the same subjects. (c) Linear regression analysis of Ang-1 as a function of MELD for the same subjects.

