Figure 1.
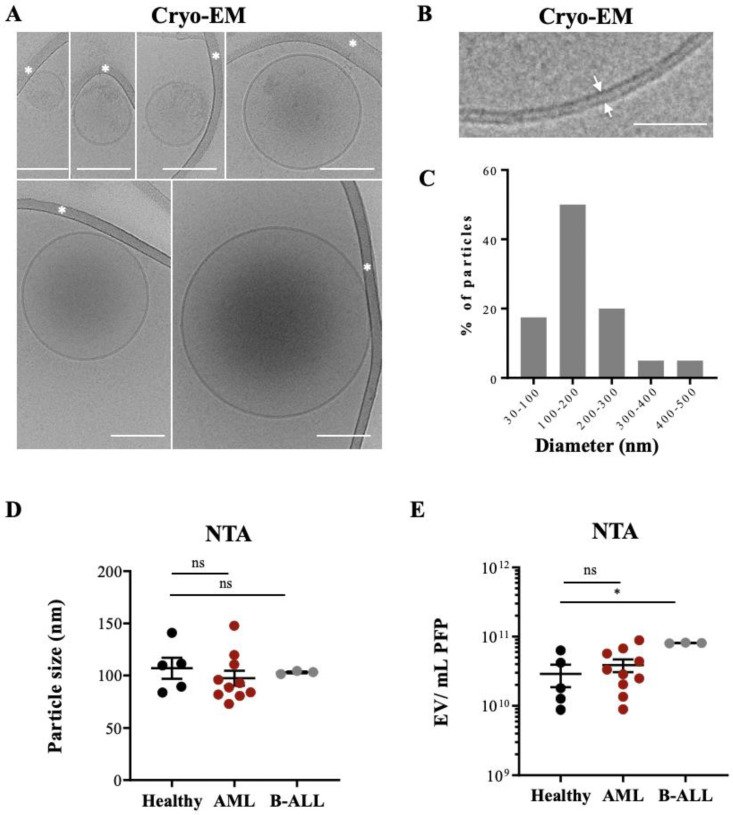
Cryo-EM of EVs isolated from leukemia-derived PFP samples: (A) Assembly of six micrographs showing single EVs of different sizes embedded in a thin film of frozen EV preparation. Some vesicles show an electron dense cargo in their lumen. Scale bar, 100 nm. White asterisks mark strands of the supporting carbon net. (B) The lipid bilayer at the vesicle membrane is resolved in two discrete lines 4 nm apart (arrows). Scale bar = 50 nm. (C) The histogram shows the size distribution of 50 EVs from one AML patient, determined by Cryo-EM. (D) PFP samples isolated from HBD (n = 5), AML (n = 10), and B-ALL (n = 3) patients were analyzed by NTA in light scatter mode and median particle size was determined. (E) Particle concentration (EVs/mL) of PFP samples from HBD and AL patients were measured by NTA. One-way ANOVA with post hoc Bonferroni was performed for multiple group comparison. * p < 0.05; ns, non-significant.

