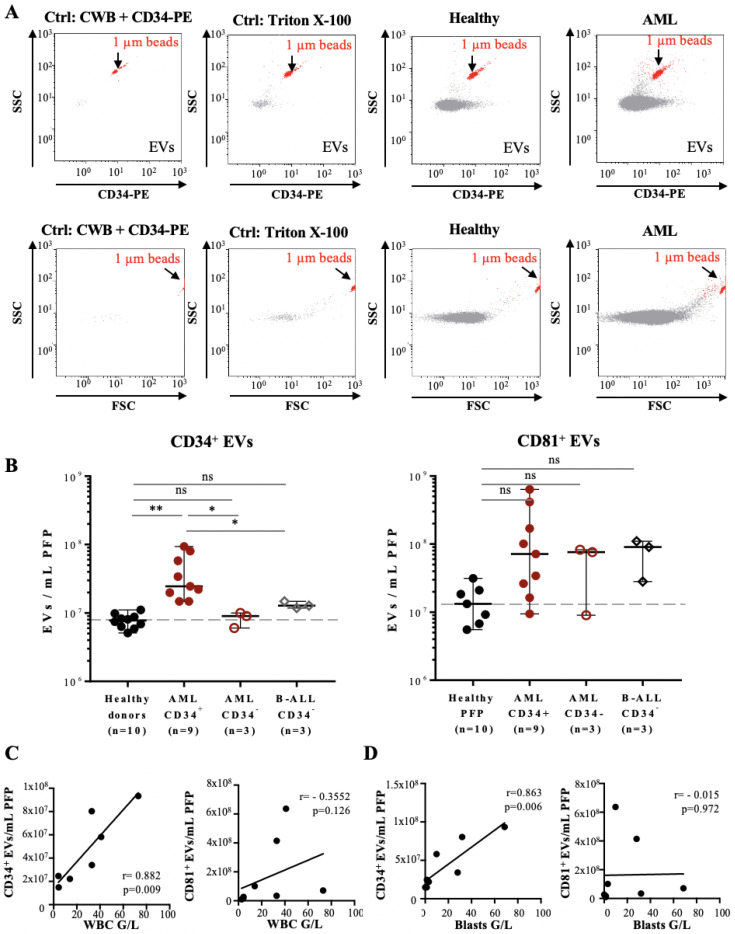
Figure 2.
Flow cytometry analysis of PFP samples from leukemia patients based on the fluorescence triggering method: (A) Representative FL-2 vs. SSC (upper panels) and FSC vs. SSC (lower panels) dot plots of PFP sample analysis by fluorescence triggering: reagents-only control (CWB containing 2% BSA and CD34-PE), negative control (PFP treated with Triton X-100, second panel), HBD (third panel), and AML patient (forth panel). PFP samples were incubated with CD34-PE antibody and FL-2 fluorescence used as a trigger, so that all detected events correspond to CD34+ EVs (upper panels). Here, 1 µm calibration beads (red) are used as an internal size and volume reference and are indicated in each dot plot. (B) Quantification of CD34+ (left panel) or CD81+ EVs (right panel) in PFP from HBDs (n = 10), CD34+ AML (n = 9), CD34-AML (n = 3), and CD34-B-ALL patients (n = 3). Error bars represent ± SEM (n = 3–10). One-way ANOVA with post hoc Bonferroni was performed for multiple group comparison. * p < 0.05; ** p < 0.01, and ns—non-significant. (C) Scatter plots with linear regression lines showing the correlation between the concentration of CD34+ EVs (left panel) and CD81+ EVs (right panel) per mL of PFP and the total WBC count (G/L) of seven AML patients at the time of diagnosis. r = 0.882, p = 0.009 (left panel), and r = −0.355, p = 0.126 (right panel). (D) Scatter plots with linear regression lines showing the correlation between the concentration of CD34+ EVs (left panel) and CD81+ EVs (right panel) per mL of PFP and the leukemic blast count (G/L) of seven AML patients at the time of diagnosis, respectively. r = 863, p = 0.006 (left panel), and r = −0.015, p = 0.972 (right panel).

