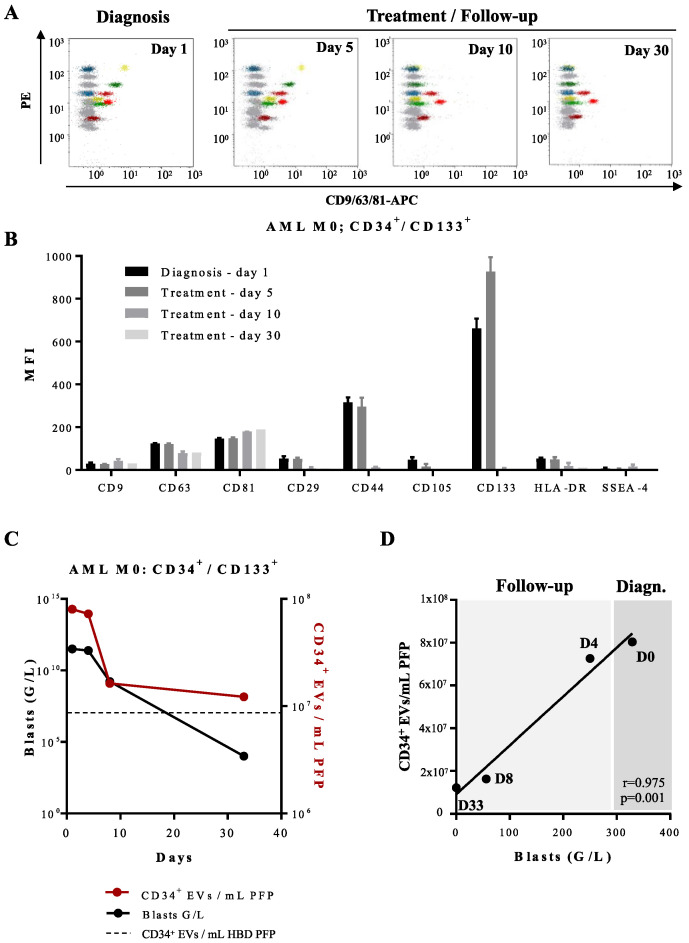
Figure 7.
Multiplex bead-based flow cytometry assay—analysis of the antigenic profile of EVs obtained from an AML patient at diagnosis and during induction treatment: (A) Representative dot plots of multiplex analysis of PFP-derived EVs from an AML patient (Patient 1; Table S1) at diagnosis (day 1), and during induction treatment on days 5, 10, and 30. (B) Median APC fluorescence intensities (MFI) for several bead populations revealed with the CD9/CD63/CD81 antibody mix at diagnosis (day 1), during the induction treatment on days 5, 10, and 30. EVs expressing CD44 and CD133 disappear from the phenotypic profile after day 5 of treatment. (C) Quantification of CD34+ EVs/mL of AML PFP measured by FT-FCM (red line) and leukemic CD34+ blasts (black line) measured by standard flow cytometry. Dotted line represents quantification of CD34+ EVs/mL of HBD PFP measured by FT-FCM. (D) Scatter plot with linear regression line showing the correlation between the concentration of CD34+ EVs/mL of PFP and the total blast count (G/L) of one AML patient (Patient 1; Table S1) at the time of diagnosis, day 0 (D0), day 4 (D4), day 8 (D8), and day 33 (D33) of follow-up. r = 0.975, p = 0.001.

