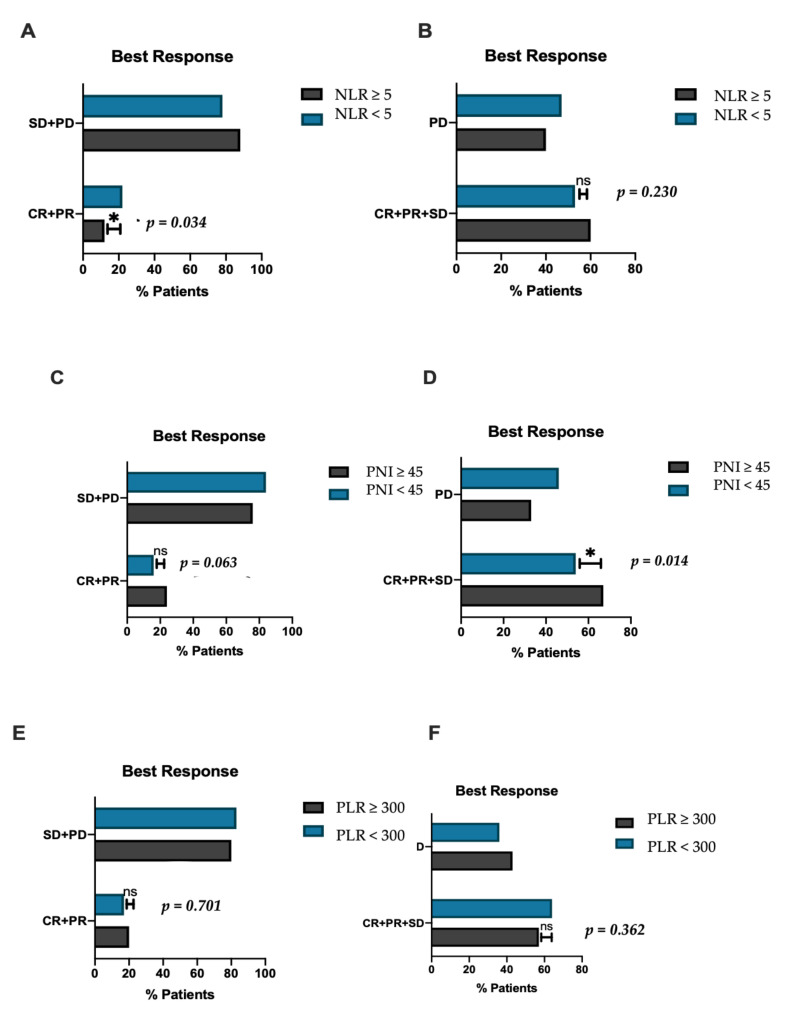
Figure 3.
Histograms demonstrating the differences in inflammatory biomarkers according to response. (A) Proportion of patients reporting objective response (CR + PR) according to neutrophil to lymphocytes ratio (NLR), (B) proportion of patients reporting disease control (CR + PR + SD) according to NLR, (C) proportion of patients reporting objective response (CR + PR) according to prognostic nutritional index (PNI), (D) proportion of patients reporting disease control (CR + PR + SD) according to PNI, (E) proportion of patients reporting objective response (CR + PR) according platelet to lymphocytes ratio (PLR), (F) proportion of patients reporting disease control (CR + PR + SD) according to PLR. NS: non-significant; * significant; SD: stable disease; PD: progressive disease; CR: complete response; PR: partial response.

