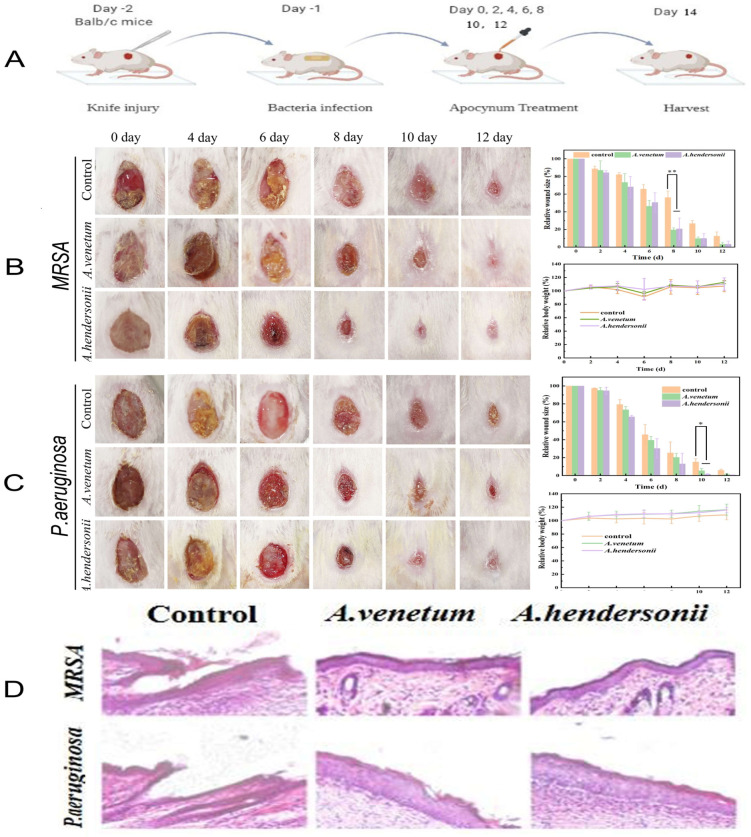
Figure 5.
In vivo antibacterial activity of the FAV and FAH in Balb/c mice. (A), Schematic illustration for the construction of wound infection and treatment procedure. (B), Photographs of MRSA infected wounds, corresponding statistical graph of wound closure rates and changes of body weight of mice with different treatment at different time. (C), Photographs of P. aeruginosa infected wounds, corresponding statistical graph of wound closure rates and changes of body weight of mice with different treatment at different time. (D), H&E staining images of infected wound tissue after various treatments for 14 days. Differences between groups with * p < 0.05 and ** p < 0.01 were regarded as statistically significant.

