FIGURE 2—

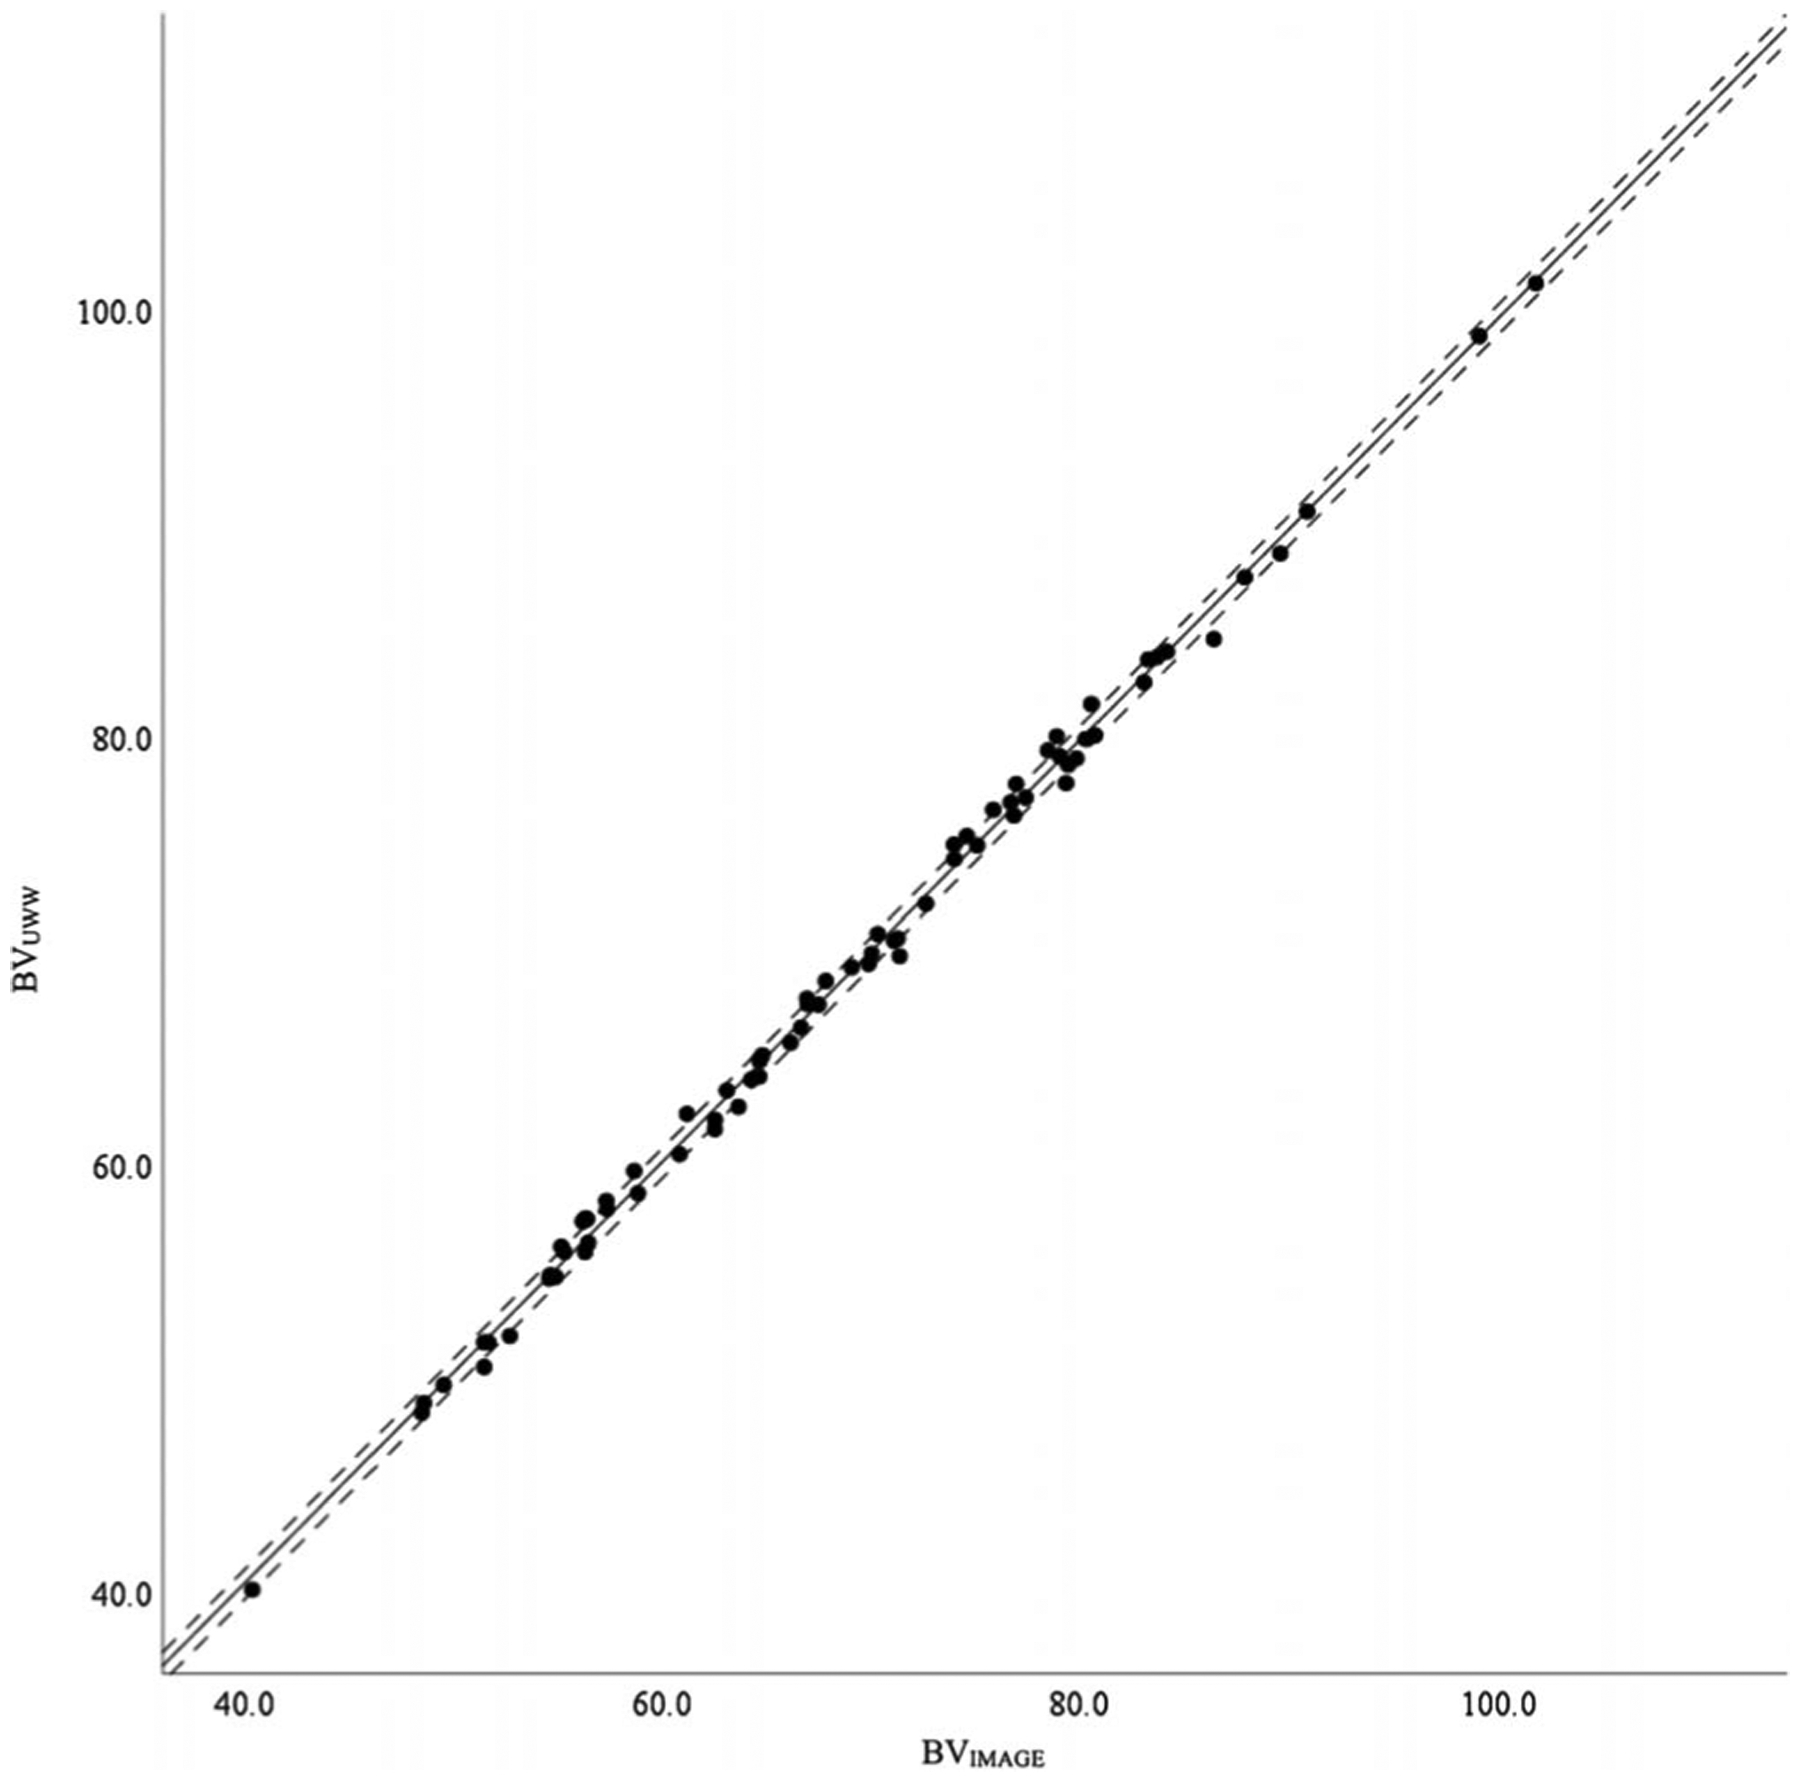
Scatterplot representing the correlation between the BV estimates of UWW and the 2D image processing system (IMAGE). The solid middle line represents the regression line, whereas the two outside dashed lines represent the SEE.

Scatterplot representing the correlation between the BV estimates of UWW and the 2D image processing system (IMAGE). The solid middle line represents the regression line, whereas the two outside dashed lines represent the SEE.