
FIGURE 5—
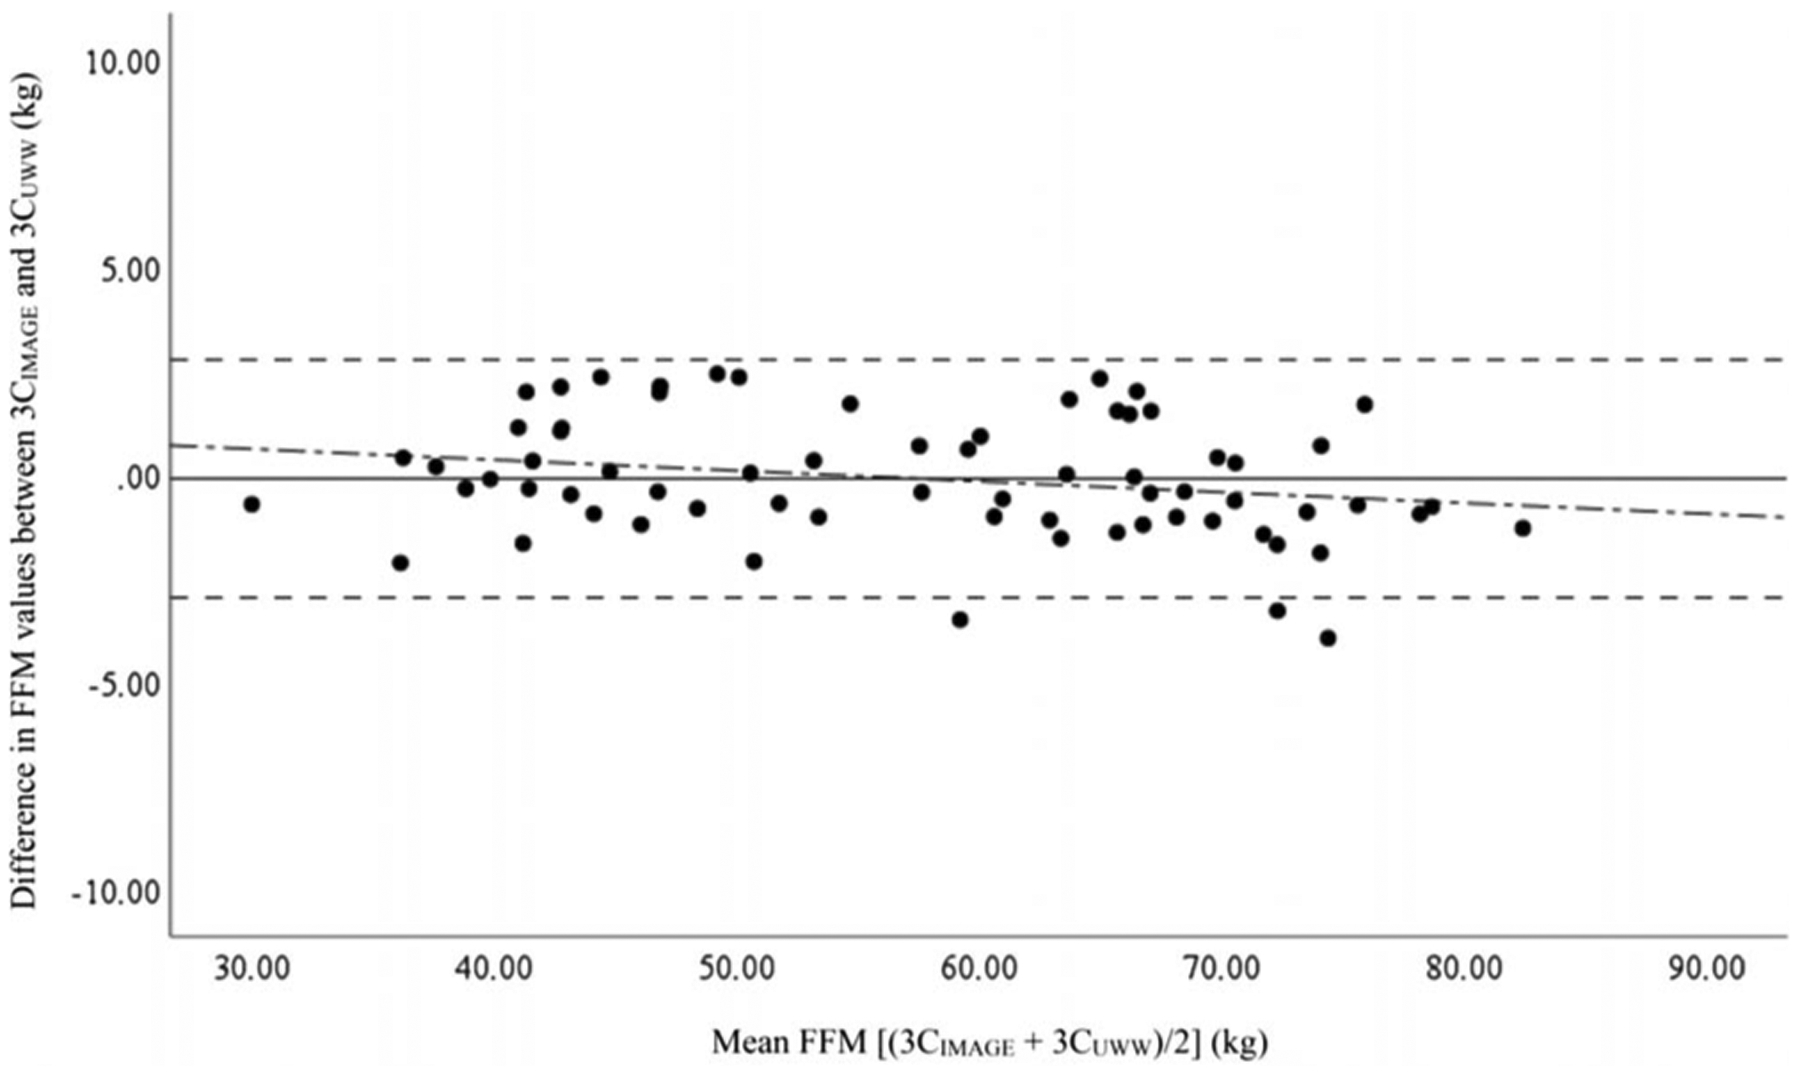
Bland–Altman plots showing the agreement between the 3C measures of FFM. The solid middle line indicates the CE. The two outside dashed lines represent the upper and lower limits of agreement. The dashed-dotted line represents the trend between the x- and y-axes. 3CIMAGE, 3C model from the 2D image technique; 3CUWW, criterion 3C from UWW.