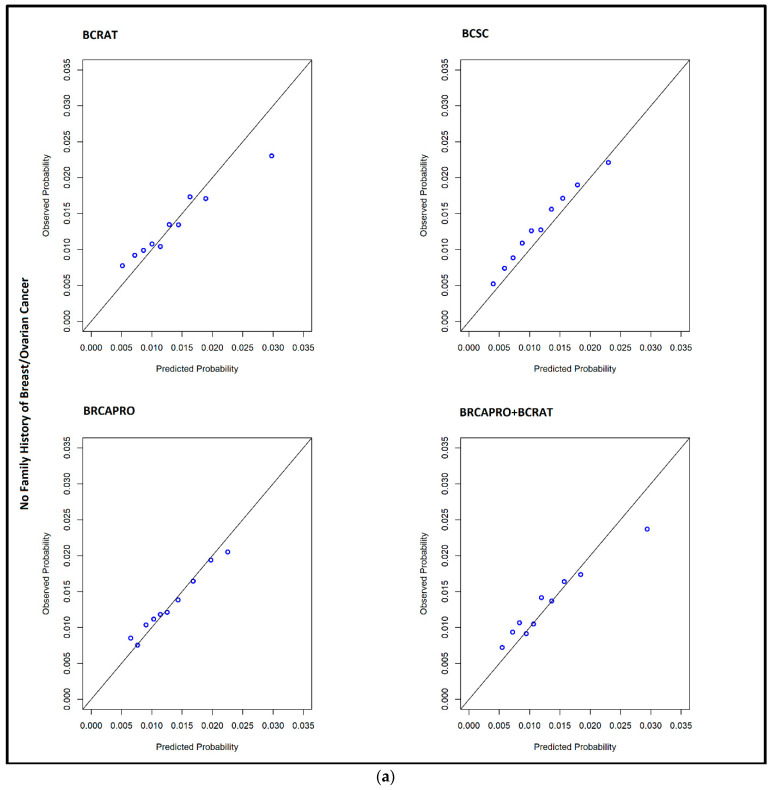
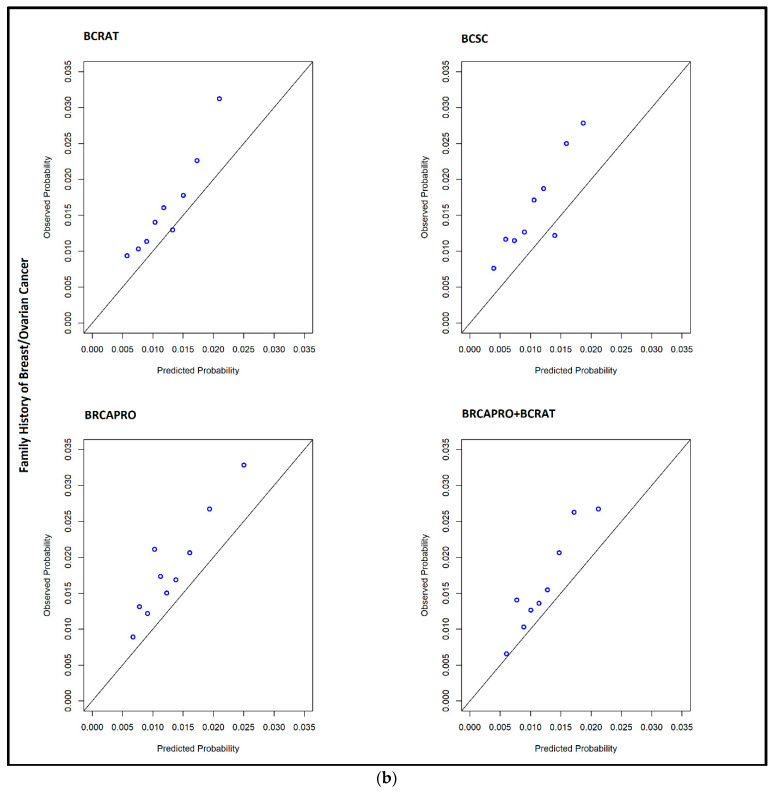
Figure A1.
(a) Calibration curves for four models for individuals with no family history of breast cancer. (b) Calibration curves for four models for individuals with a family history of breast cancer. Each point on the figure represents the observed probability of breast cancer (Y-axis) for each decile of probability of breast cancer predicted by the model (X-axis). The diagonal line indicates perfect agreement between predicted and observed probability of breast cancer.


