Figure 1.
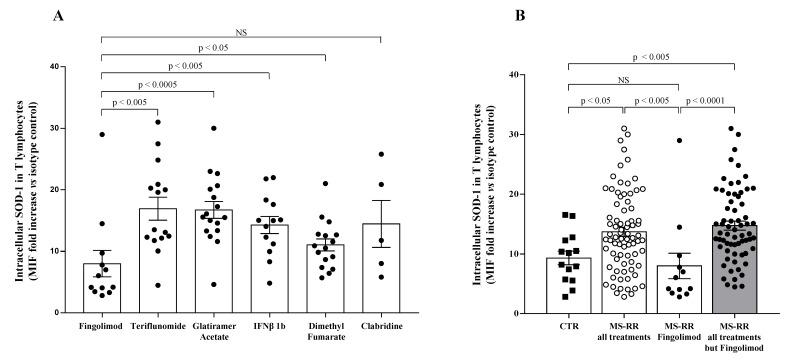
T cells from MS-RR individuals undergoing immune-modulating treatment, except fingolimod, showed significant increase of SOD-1 intracellular levels, as compared with healthy controls. (A) SOD-1 level in T lymphocytes obtained from MS-RR subjects undergoing different immune-modulating treatments. SOD-1 intracellular amount was expressed as the ratio of the mean intensity fluorescence (MIF) value for T-cell population and the control MIF value obtained after staining of the same cell subset with the isotype control mAb (see Patient and Method section). Each column refers data obtained in MS-RR subjects categorized according to the treatment they underwent. As shown, all treatments were able to increase SOD-1 levels in T lymphocytes, as compared with fingolimod. (B) Intracellular SOD-1 content in T lymphocytes of healthy controls (n = 14; white column with black squares), MS-RR subjects as a whole (n = 78; white column with white dots), MS-RR individuals undergoing fingolimod treatment (n = 12; white column with black dots), and MS-RR individuals undergoing all treatments, except Fingolimod (n = 64; grey column with black dots). As shown, when MS-RR individuals were grouped according to the treatment, significant SOD-1 increase in T cells only characterized the subjects undergoing all immune-modulating therapies, except fingolimod. Statistical evaluation of data was performed by means of the Mann–Whitney test. Statistically significant values are indicated.

