Figure 5.
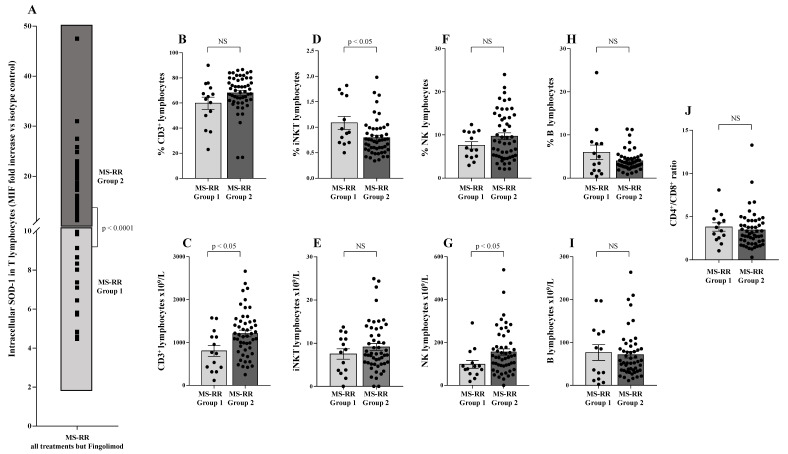
SOD-1 intracellular content in T cells identified two sub-groups of MS-RR individuals undergoing immune-modulating therapy, except fingolimod. (A) Analysis of SOD-1 distribution in T lymphocytes of MS-RR subjects undergoing all treatments, but fingolimod; as shown, Group 1 is MS-RR subjects characterized by SOD-1 intracellular content in T cells similar to healthy individuals (light grey box; SOD-1 MIF fold increase vs. isotype control <10); Group 2 is MS-RR subjects characterized by SOD-1 intracellular content in T cells significantly higher than healthy individuals (dark grey box; SOD-1 MIF fold increase vs. isotype control >10). (B,D,F,H) Percentage of circulating CD3+, iNKT, NK, and B lymphocytes, respectively. (C,E,G,I) Numbers of CD3+, iNKT, NK, and B lymphocytes, respectively. (J) CD4+/CD8+ ratio. Statistical evaluation of data, was performed by means of the Mann–Whitney test.

