Figure 6.
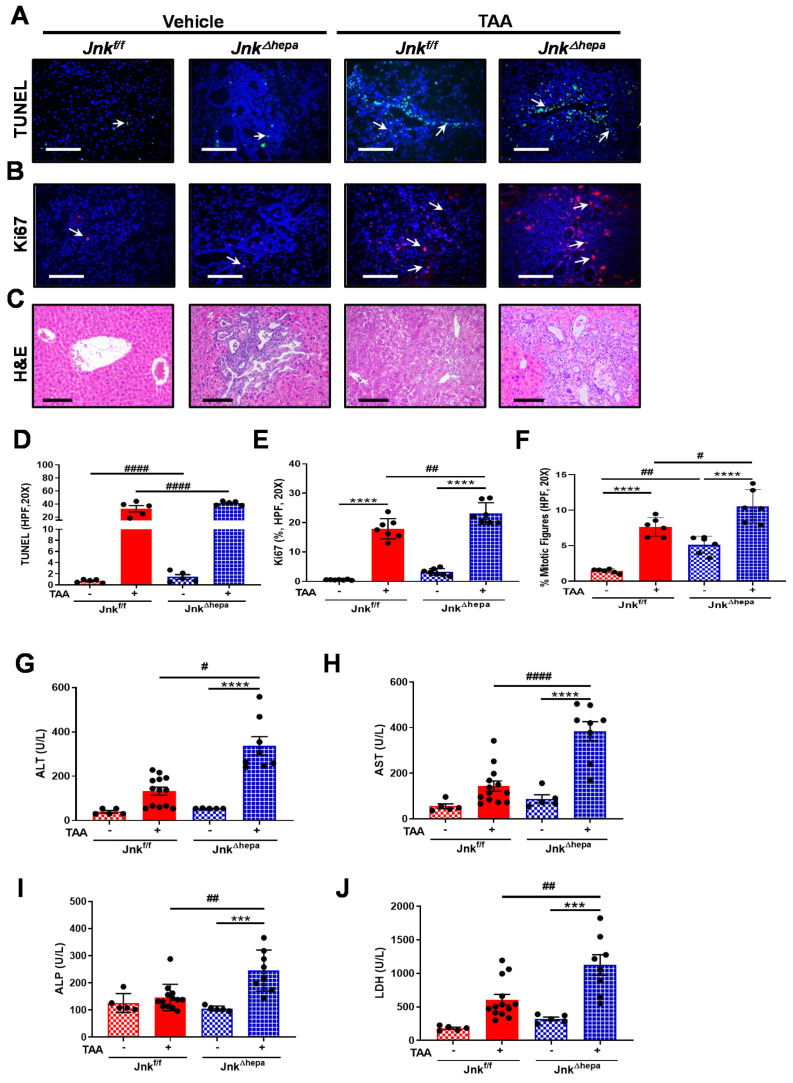
Jnk∆hepa mice display extensive hepatocellular and cholangiocellular injury in response to TAA. (A) Cell death was evaluated using TUNEL staining of liver tissue sections from TAA-treated Jnkf/f and JnkΔhepa mice. Arrows (→) indicate TUNEL positive cells. Scale bars, 50 μm. (B) Expression of Ki67 was evaluated by IF staining. Scale bars, 50 μm. (C) Liver histopathology was analyzed by H&E staining in each experimental group. Positive TUNEL (D), Ki67 cells (E) and frequency of mitotic figures (F) were analyzed by ImageJ and graphed. (G–J) Analysis of serum levels of ALT, AST, ALP and LDH was assessed. Data were represented as the mean ± SEM and graphed (n = 5–13 mice per group; # p < 0.05; ## p < 0.01; *** p < 0.001; ****/#### p < 0.0001).

