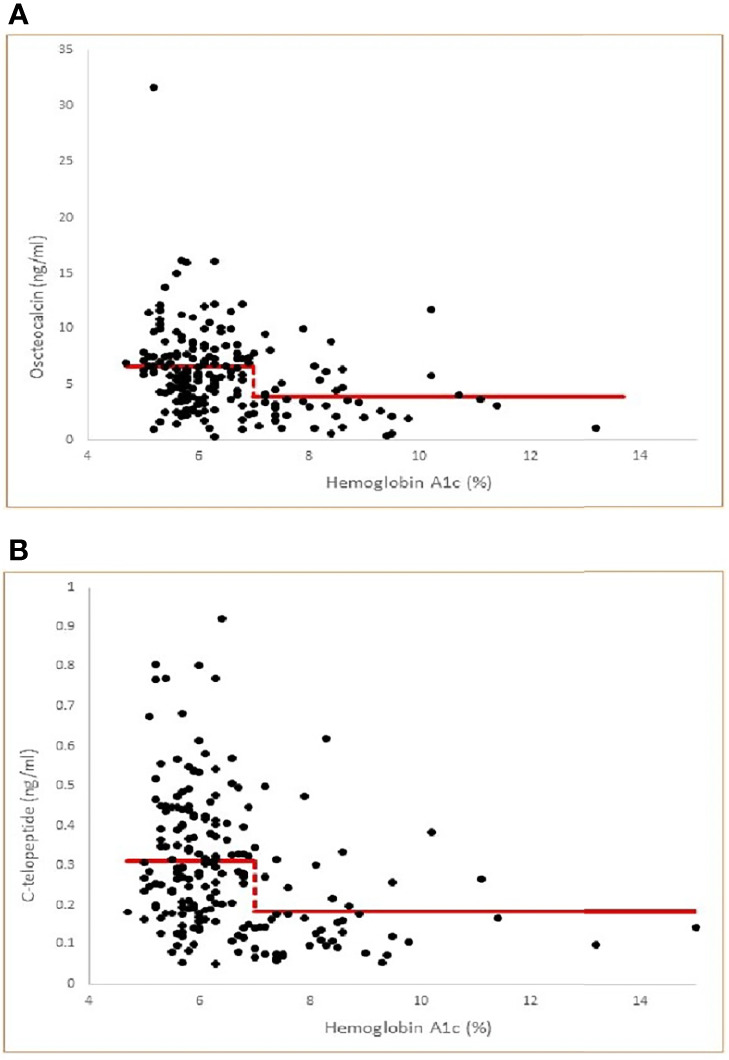
Figure 1.

(A) Threshold model of Osteocalcin versus Hemoglobin A1c by nonlinear regression (multiple correlation r=0.31, p<0.001) with least squares fitted (optimal) threshold A1c=7.0. Model Osteocalcin values= 6.57 for A1c< 7.0 and 3.86 for A1c ≥ 7.0. The threshold model is statistically significant compared to a null hypothesis of no threshold (P<0.001). (B) Threshold model of C-telopeptide versus Hemoglobin A1c by nonlinear regression (multiple correlation r=0.31, p<0.001 with least squares fitted (optimal) threshold A1c=7.0. Model C-telopeptide values= 0.311 for A1c < 7.0 and 0.182 for A1c ≥ 7.0. The threshold model is statistically significant compared to a null hypothesis of no threshold (p<0.001).
