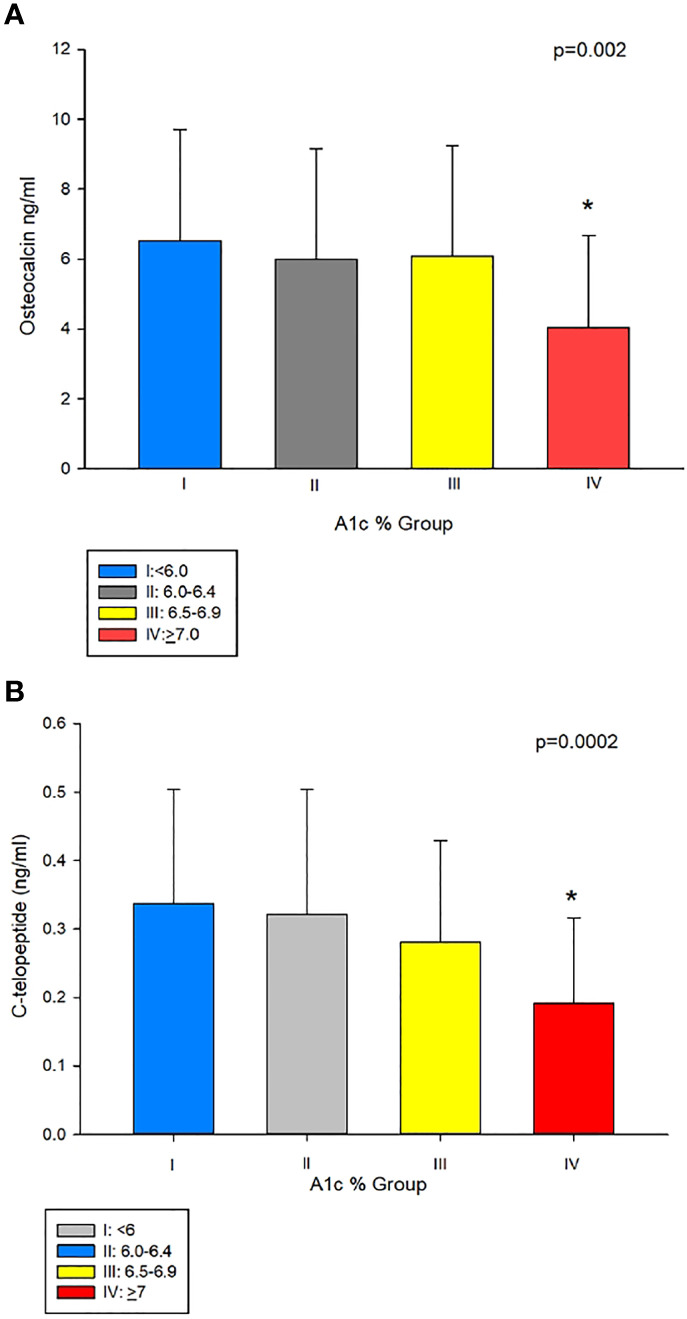
Figure 2.

(A) Osteocalcin (OC) in group IV (A1c<7%), compared to groups with A1cs ≥7%, i.e. I II, and III (4.04 ± 2.64 vs 6.53 ± 3.18, 5.99 ± 3.16 and 6.09 ± 3.16 ng/mL, respectively, p = 0.002). (B) C-telopeptide (CTx) was lower in group IV compared to groups I, II, and III (0.1 9 ± 0.12 ng/mL vs 0.34 ± 0.17, 0.32 ± 0.18 and 0.28 ± 0.14 ng/mL, respectively, p=0.0002). *Post-hoc analysis: p<0.05 showed significant difference in OC and CTx in group IV compared group I, II and III.
