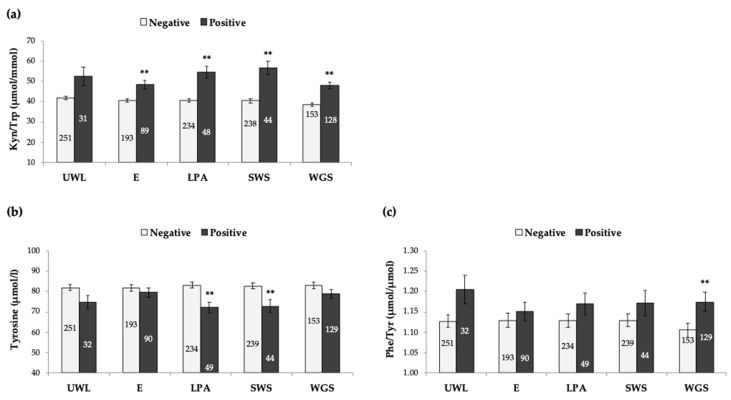
Figure 2.
Kyn/Trp (a), Tyrosine (b) and Phe/Tyr (c) in the population analysed, according to each frailty criterion (Fried et al., 2001). Bars represent mean ± standard error. The number of individuals in each group is indicated inside each rod. ** p < 0.001, significant difference with regard to negative scoring (Student’s t-test). UWL: unintentional weight loss; E: exhaustion; LPA: low physical activity; SWS: slow walking speed; WGS: weakness of grip strength.

