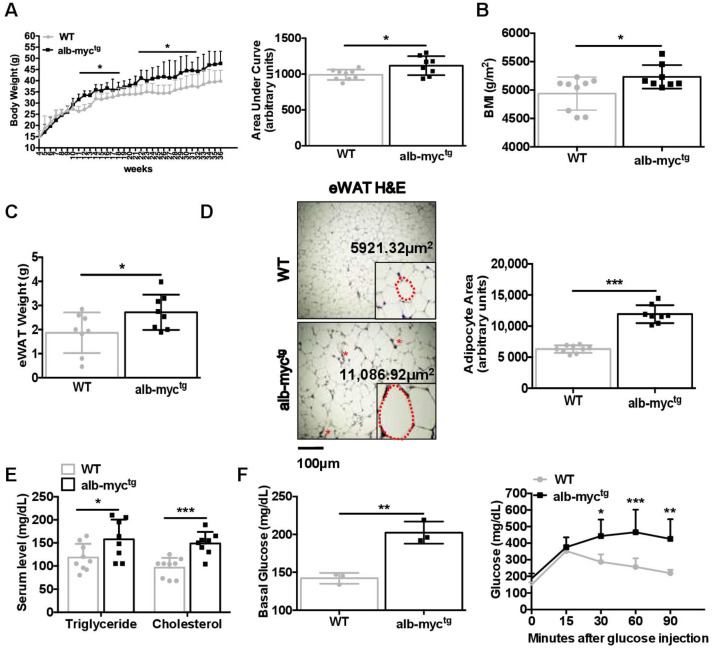
Figure 2.
Metabolic profile of chow diet-fed alb-myctg mice at the age of 36 weeks. (A) Left: Growth curve demonstrating body weight gain, assessed at 7 days’ interval for each group. Right: The histogram represents the incremental area under the respective grow curve (n = 8–9). (B) Body mass index (BMI) (g/m2) (n = 8–9). (C) Weight of epididymal white adipose tissue (eWAT) (n = 8). (D) Size of eWAT cells by H&E staining. Scale bar = 100 µm. Size of individual cells from both groups was measured and average cell size (µm2) was quantified (n = 8–9). Asterisks indicate CLS. The dotted red line marks the individual adipocyte. (E) Levels of cholesterol and TG in serum (n = 8–9). (F) Basal glucose level in blood after 6 h fasting; Blood glucose concentration curve during intraperitoneal glucose tolerance test (n = 3). Data are expressed as the mean ± SD, * = p < 0.05; ** = p < 0.01, *** = p < 0.001, alb-myctg mice vs. WT controls.

