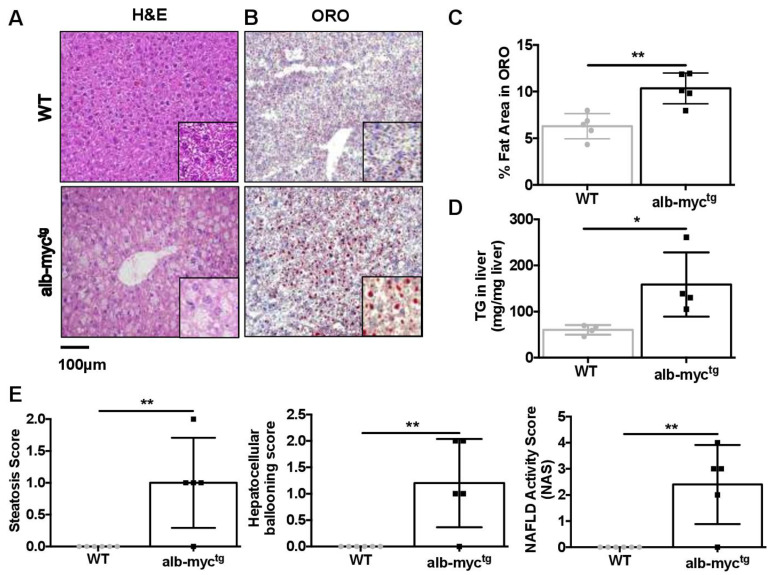
Figure 3.
Steatotic changes in the liver of transgenic mice. (A) Representative liver H&E staining demonstrating distended hepatocytes with foamy appearing cytoplasm and small lipid vesicles. Scale bar = 100 µm (n = 8–9). (B) Illustrative ORO staining. Scale bar = 100 µm. (C) Quantitative analysis of ORO-stained area (n = 5). (D) Direct TG quantification (n = 4). (E) Histology score for steatosis, hepatocyte ballooning, NAFLD activity score (NAS) (n = 5–6). Data are expressed as the mean ± SD, * = p < 0.05; ** = p < 0.01, alb-myctg mice vs. WT controls.

