Figure 5.
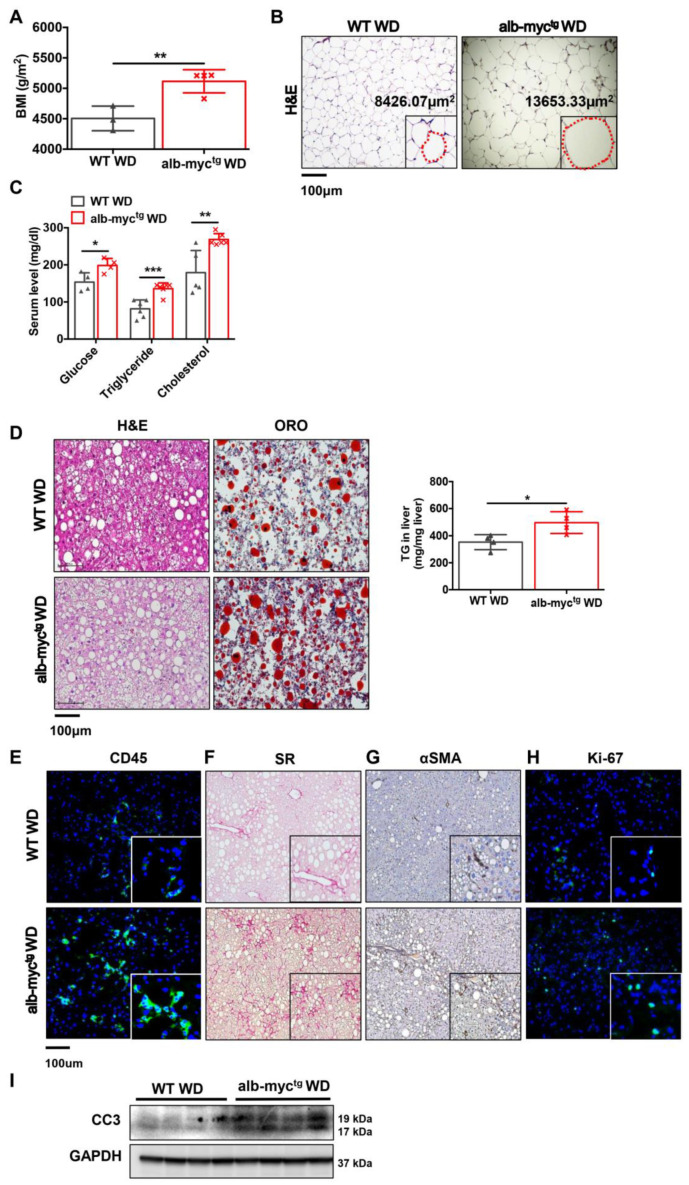
WD feeding accelerates liver injury in alb-myctg mice. WT (n = 6) and alb-myctg (n = 7) mice fed for 24 weeks with WD. (A) Body mass index (BMI) (g/m2) of mice was calculated at the age of 36 weeks (n = 3–4). (B) H&E staining of epididymal white adipose tissue (eWAT). The dotted red line marks the individual adipocyte. Scale bar = 100 µm. (C) Fasting blood glucose, levels of cholesterol and TG in serum (n = 6–8). (D) Representative liver sections stained with H&E and ORO are shown. Scale bar = 100 µm. Histogram showing TG quantification of mice fed WD (n = 4). (E) Representative images of hepatic inflammation (CD45 positive cells stained in green). (F,G) Liver fibrosis (SR and αSMA IHC staining). (H) Hepatic proliferation (Ki-67 positive cells in green). Scale bar = 100 µm. (I) Protein expression of cleaved caspase 3, GAPDH used as loading control (n = 3). Uncropped blots are presented in Figure S15. Data are expressed as the mean ± SD, * = p < 0.05, ** = p < 0.01, *** = p < 0.001, alb-myctg mice fed with WD compared to WT fed with WD.

