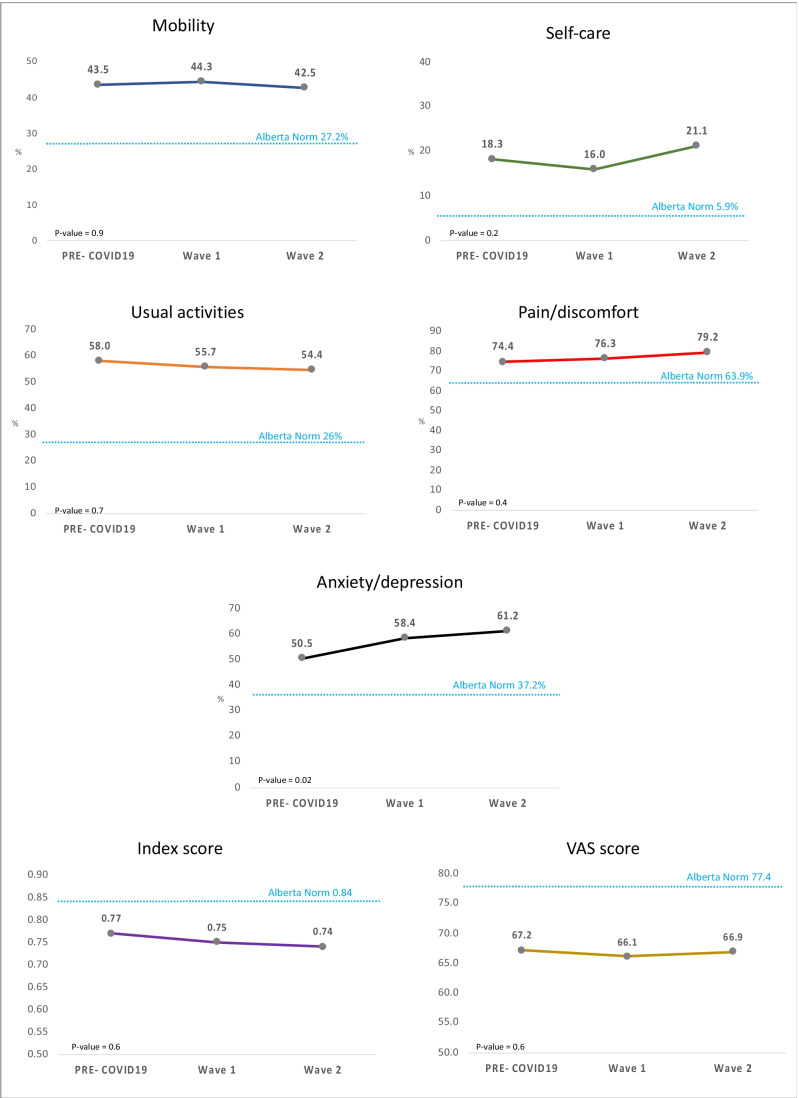
Fig. 2.
Proportion of mild–extreme problems (levels 2–5) in EQ-5D-5L dimensions and index and VAS scores by COVID-19 period in primary care survey compared to Alberta population norms. VAS, visual analogue scale. Index score ranges from -0.149 to 0.949; VAS score ranges from 0 to 100. p-values are for statistical tests comparing values across the three COVID-19 periods

