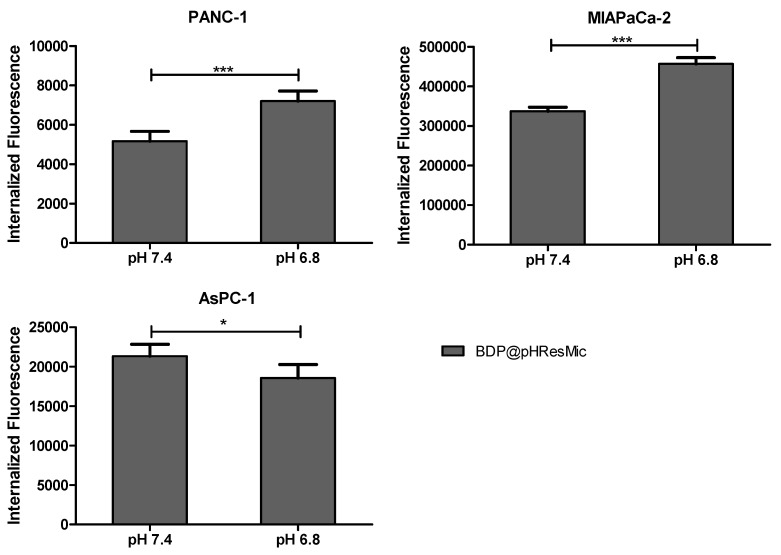
Figure 7.
Histogram plots showing the results of uptake studies of pHResMic on 2D model of PDAC cells. The histograms report the amounts of internalized BDP@pHResMic, expressed as the difference between mean fluorescence at 37 °C and at 4 °C registered values, obtained after 1 h incubation of cells with micelles at pH 7.4 or pH 6.8. Histogram bars represent the mean ± SD of three independent experiments. (* p < 0.05, *** p < 0.001).

