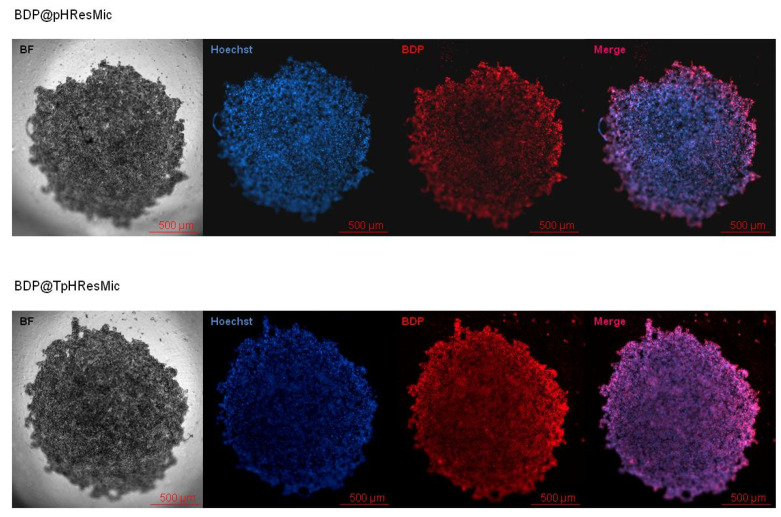
Figure 9.
Fluorescence uptake studies on 3D model of PANC−1 cells. The upper panel shows the bright field (BF) image of the spheroid, the fluorescence intensities of Hoechst (blue—nuclei), BDP (red—BDP@pHResMic), and a merge of them; the lower panel shows the bright field (BF) image of the spheroid, the fluorescence intensities of Hoechst (blue—nuclei), BDP (red—BDP@TpHResMic), and a merge of them. Scale bar 500 μm.

