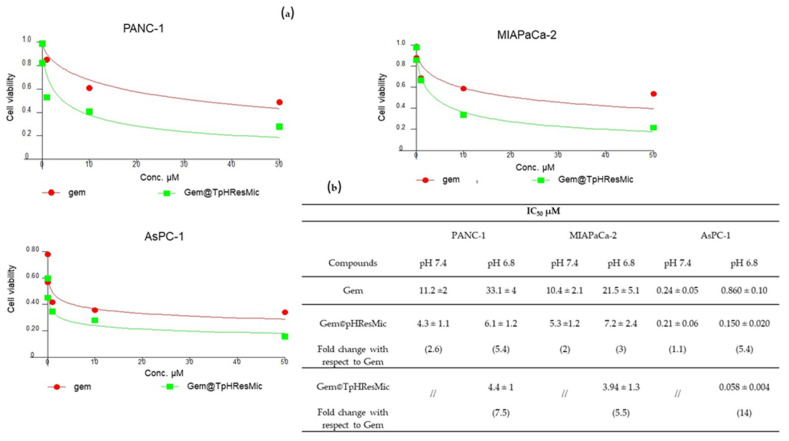
Figure 10.
(a) Dose/effect plots of the mean of three different cell viability experiments, conducted in PDAC cell lines incubated for 24 h + 48 h w.o. with free Gem or Gem@TpHResMic. (b) IC50 values of PDAC cell lines treated with all treatment conditions; the data are reported as the mean of three independent experiments.

