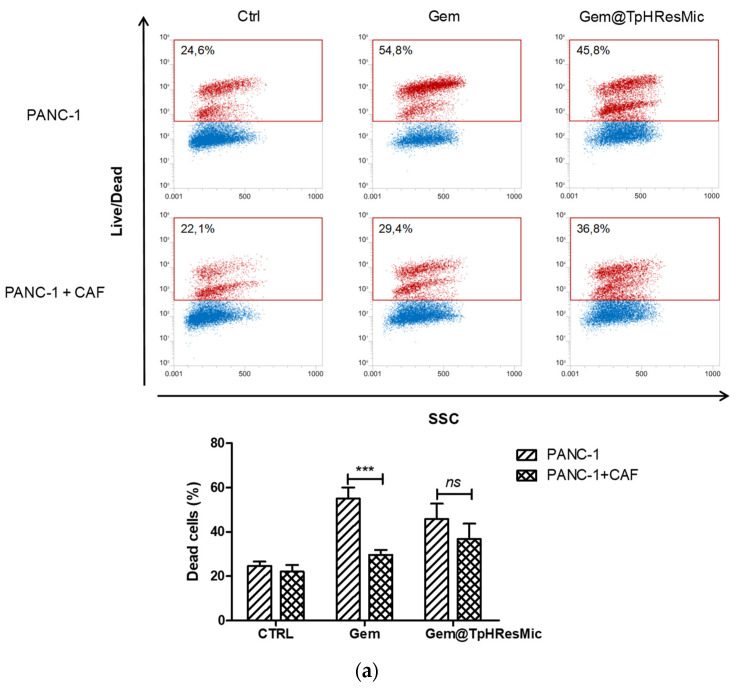
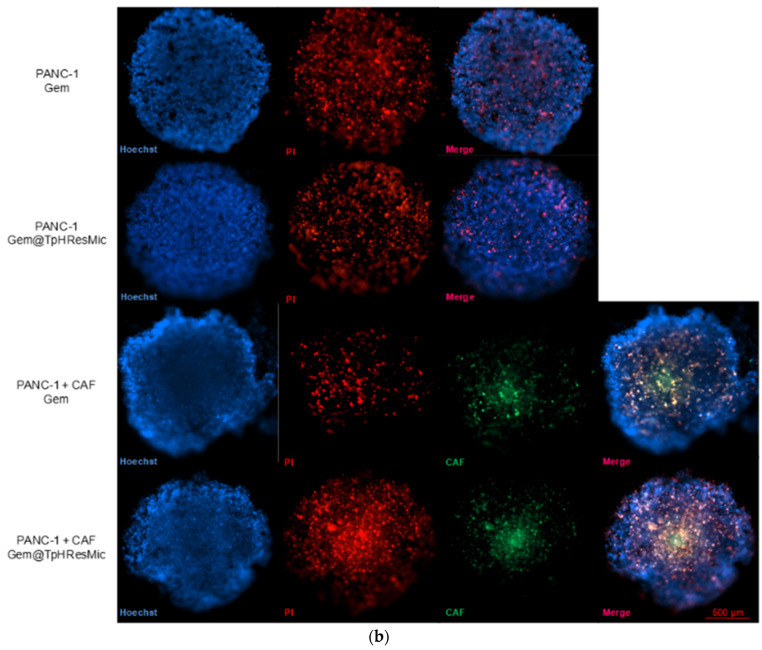
Figure 11.
(a) Representative FCM dot plots of viability analysis conduct on PANC−1 and PANC−1/CAF spheroids after treatment with Gem@TpHResMic or free Gem. The histograms plots show the % of dead cells in all conditions, reported as the mean ± SD of three independent experiments. (b) Representative fluorescence images of viability evaluation in PANC−1 or PANC−1/CAF spheroids (blue—nuclei; green—CAF; red—dead cells). *** p < 0.001. Scale bar 500 μm.


