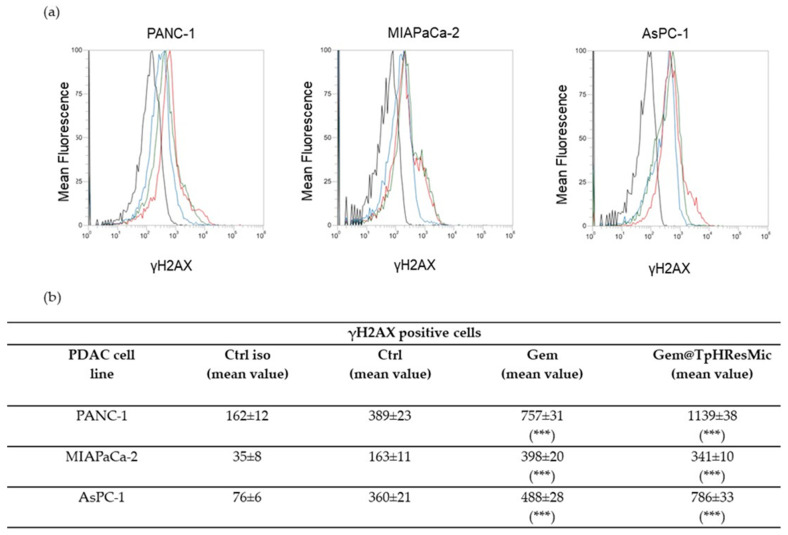
Figure 12.
(a) Representative FCM histograms showing the γH2AX positive PDAC cells after treatment for 24 h at pH 6.8 with free Gem or Gem@TpHResMic (black line—isotype ctrl; blue line—ctrl; green line—Gem; red line—Gem@TpHResMic). (b) Mean values of γH2AX-positive PDAC cells in all treatment conditions are reported as the mean ± SD of the three independent experiments (*** p < 0.001 as respect to untreated cells; Ctrl—untreated cells).

