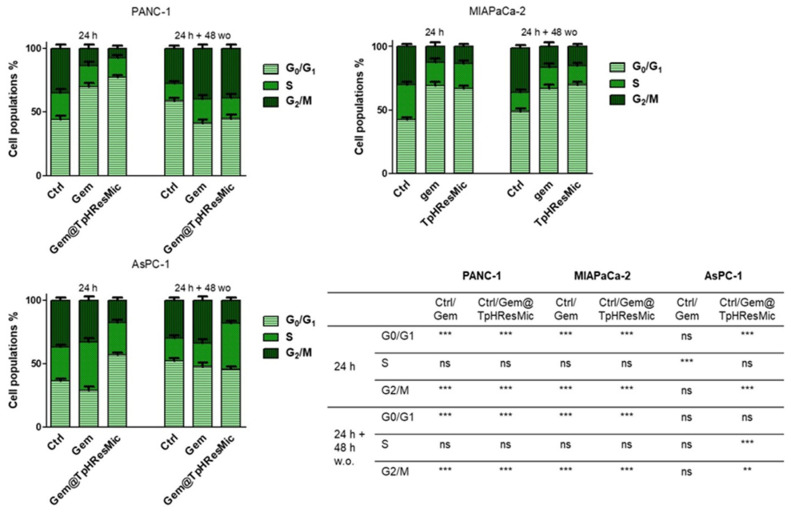
Figure 13.
Cell cycle perturbation of PDAC cells by free Gem and Gem@TpHResMic at pH 6.8 after 24 h and 24 h + 48 h w.o. The modulation of cell cycle phases was evaluated by FCM analysis after staining the cells with propidium iodide. The bar graphs show % cell population distributions in G0/G1, S, or G2/M phases, reported as the mean ± SD of the three independent experiments, and the statistical significances are reported in the table (** p < 0.01, *** p < 0.001).

