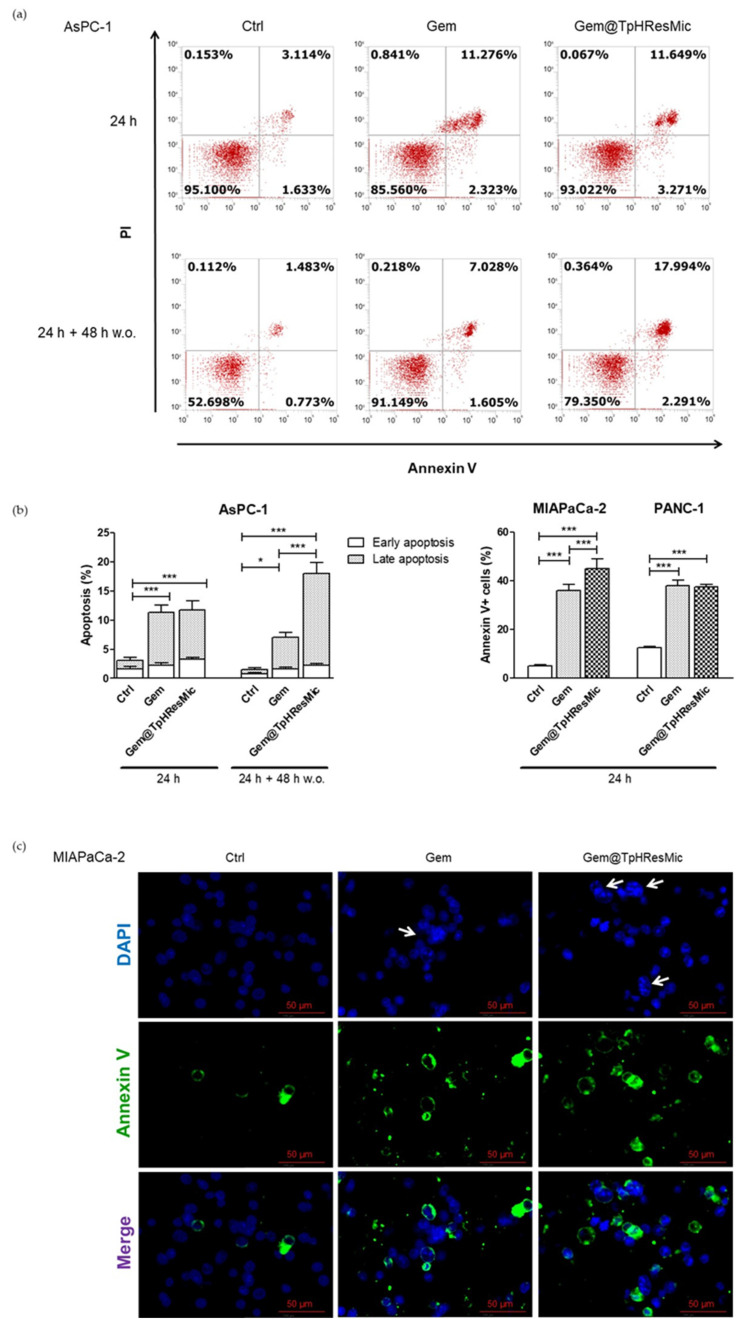
Figure 14.
Evaluation of induction of apoptosis in PDAC cell lines treated with Gem and Gem@TpHResMic. (a) Representative dot plots showing FCM analysis in AsPC−1 cell line. (b) Bar graphs summarizing the results of the assays, as the mean ± SD of the three independent experiments (* p < 0.05, *** p < 0.001). (c) Representative IF images of the MIAPaCa-2 cell line, showing nuclei features (white arrows show polynucleated cells) and Annexin V-positive cells (blue—DAPI-stained nuclei; green—Annexin V).

