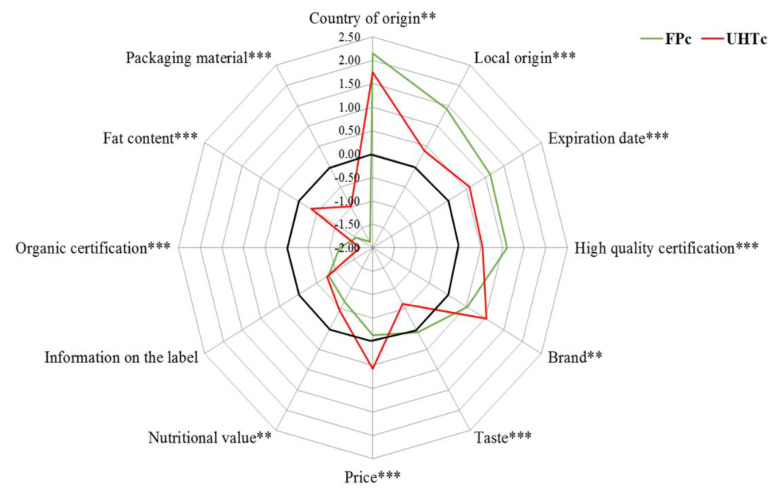
Figure 1.
Level of importance (average raw scores) given by the FP and UHT milk consumers to the 12 milk quality attributes. Notes: the differences between the average raw scores for each milk attribute between the two consumers’ groups tested through the Mann-Whitney U test were significant at the 5% (**) and at the 1% level (***).

