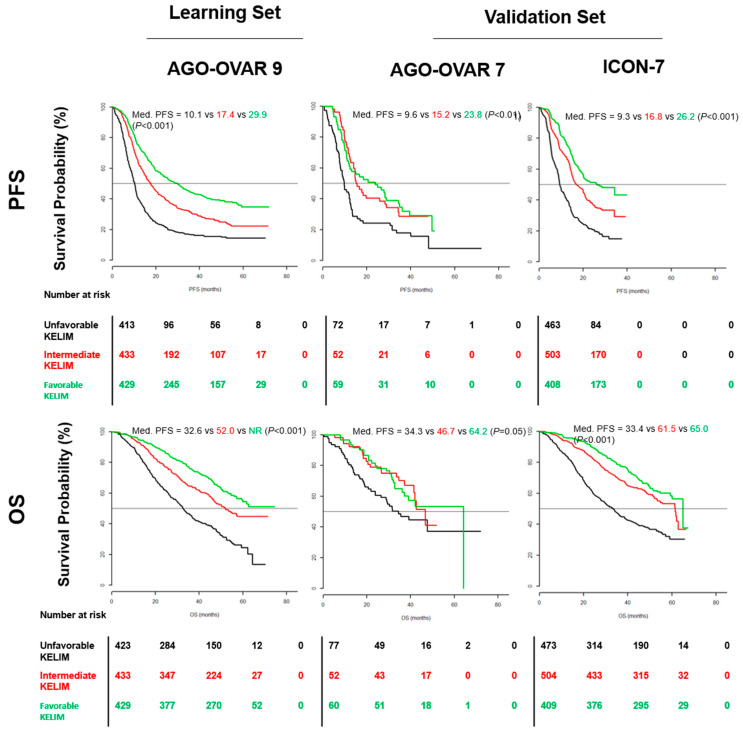
Figure 2.
Kaplan–Meier analyses of PFS and OS in the learning set AGO OVAR 9 and the two validation sets AGO OVAR 7 and ICON-7. Black line, unfavorable KELIM tercile (minimum–0.05) days-1; red line, intermediate KELIM tercile (0.05−0.07) days−1; green line, favorable KELIM tercile (0.07–maximum) days−1; P: univariate log-rank tests; Med.: median. (Adjusted from Colomban et al., Clin Cancer Res 2019 [23]).

