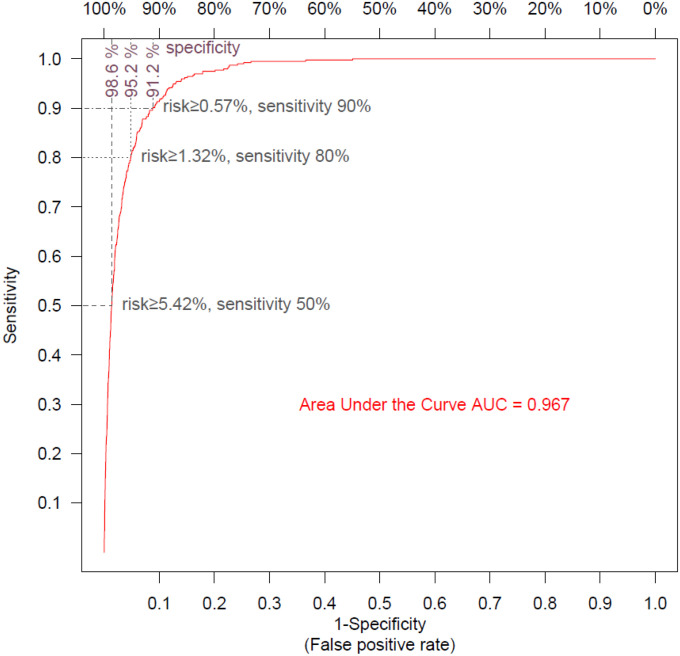
Figure 2:
Receiver Operating Curve for mortality risk model
The ROC curve shows the sensitivity and the specificity of the mortality model as its discrimination threshold is varied. With a threshold of 5.42% for risk, 50% of the COVID-19 episodes ending in patient death can be identified (sensitivity=50%), and specificity is 98.6% (false positive rate=1.4%); with a risk threshold of 1.32%, sensitivity is 80% and specificity is 95.2% (false positive rate =4.8%); with a risk threshold of 0.57%, sensitivity is 90% and specificity is 91.2% (false positive rate=8.8%).

