Figure 3.
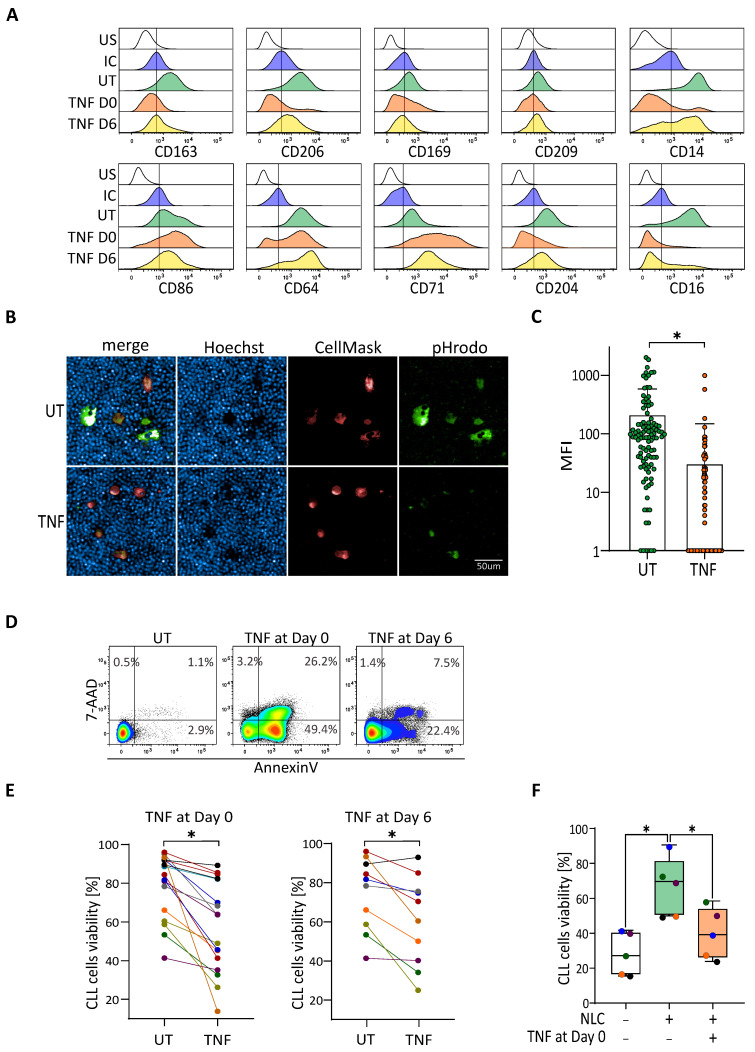
TNF depolarizes protective NLC, leading to a decrease of CLL cells viability. (A) Surface markers expressed by NLC analysed by flow cytometry at 14 days of CLL’s PBMC cultures incubated or not (UT: green) with TNF at day zero (orange) or at day six (yellow), compared to the unstained (US: white) and the isotypic (IC: blue) controls. Representative histograms from eight independent experiments. (B,C) Phagocytosis of CLL cells (blue dots) by NLC (red) is visualized. (B) upper: untreated; lower: TNF treated and quantified (C) thanks to the green pHrodo fluorescence. (D,E) Percentage of CLL cells viability at 14 days of culture of CLL PBMC-incubated or not (UT) with TNF at day zero or at day six. (D) one representative experiment. (E) A total of 19 independent experiments for TNF treatment at day zero and 10 independent experiments at day six. (F) Co-culture experiments: percentage of the CLL cells viability cultivated alone (white) or co-cultivated with autologous control NLC (untreated, green) or depolarized NLC (previously treated with TNF; orange). * indicates p < 0.05.

