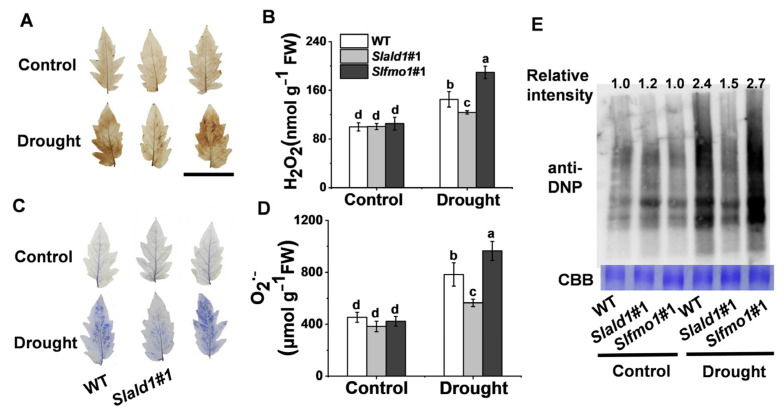
Figure 5.
Drought-induced changes in ROS concentrations and protein oxidation in Slald1 and Slfmo1 mutants. (A) Representative images of in situ H2O2 accumulation detected by DAB staining. Bar = 5 cm (B) Quantification of H2O2. (C) Representative images of O2·− accumulation as determined by NBT staining. (D) Quantification of O2·−. (E) Oxidized protein levels as detected by immunoblot analysis with anti-DNP antibody. Leaf samples were collected from Slald1, Slfmo1 mutants and WT plants after 48 h of control and drought treatment. The data are presented as mean values ± SD, n = 4. Different letters (a, b, c, d) above each bar indicate significant differences at p < 0.05 (Tukey’s test) among treatments.

