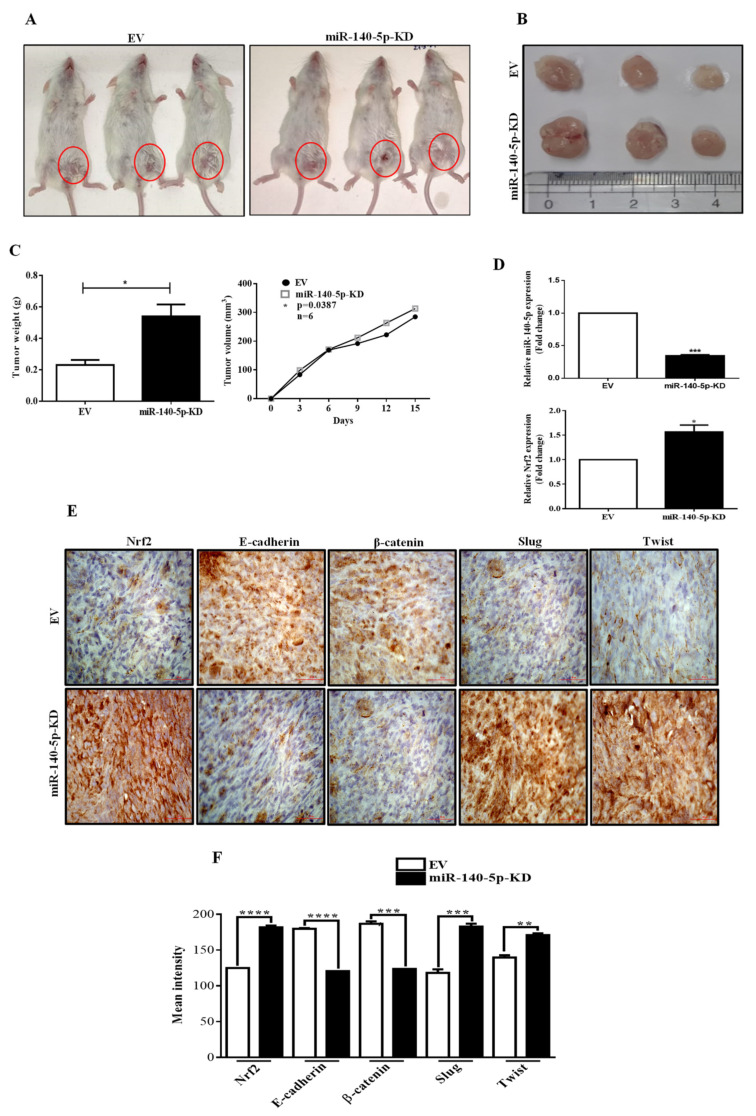
Figure 8.
Tumorigenicity assay in a mouse model. (A,F) EV or miR-140-5p-KD MDA-MB-231 cells were subcutaneously administered into the mammary fat pad of NOD/SCID mice. (B) NOD/SCID mice xenograft tumors. (C) Average tumor weight and volume (mm3) were plotted. (D) miR-140-5p and Nrf2 expression in xenograft tumors as measured by qRT-PCR. (E) IHC staining of the EMT markers in the xenograft tumors (60x objective lens). Error bars indicate mean ± SEM (n = 3). Student’s t-tests were used to compare the means of two groups. * p < 0.05, ** p < 0.01, *** p < 0.001, and **** p < 0.0001 compared to EV.

