
Figure 2.
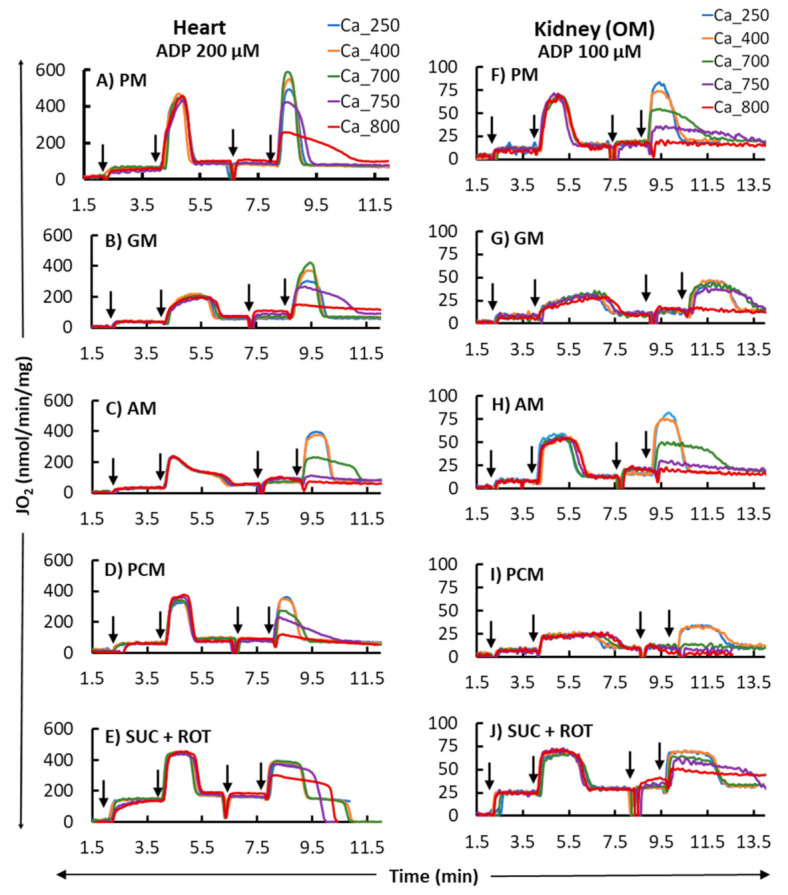
Representative time courses of mitochondrial O2 consumption rates (OCR; JO2) for different respiratory substrates (PM, GM, AM, PCM, and SUC + ROT) in the heart (left panel; (A–E) and kidney OM (right panel; (F–J). States 2, 3, and 4 OCR were monitored by adding the substrates at t = 2 min and ADP (200 and 100 µM final concentration for heart and kidney OM mitochondria, respectively) at t = 4 min, which initiated state 3 respiration proceeding to state 4 respiration after the conversion of the added ADP to ATP. Different concentrations of CaCl2 (250, 400, 700, 750, and 800 µM) in the presence of 1 mM Ca2+ chelator EGTA were added in parallel experiments approximately 1 min after reaching the state 4 respiration, and this was followed by the addition of another ADP with the same concentration as used above. The times at which the reagents were added to the mitochondrial suspension are indicated by the vertical arrows.