
Figure 3.
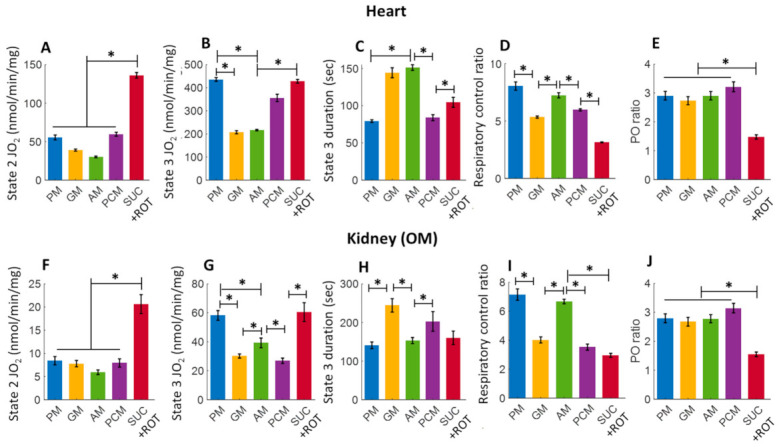
Summary of the different substrate-dependent respiratory parameters derived from the mitochondrial O2 consumption rates (OCR; JO2) of Figure 2 before adding CaCl2 (CaCl2 = 0) for the heart (upper panel; (A–E) and kidney OM (lower panel; (F–J). (A,F) State 2 JO2; (B,G) State 3 JO2; (C,H) State 3 duration of JO2; (D,I) Respiratory control ratio (RCR; state 3/state 2 JO2); and (E,J) PO ratio (ratio of ADP consumed to O2 consumed). Each bar plot represents the mean value ± SEM (n = 4–6). The symbol ‘*’ shows the statistical significance (p < 0.05) based on one-way ANOVA with repeated measures.