
Figure 7.
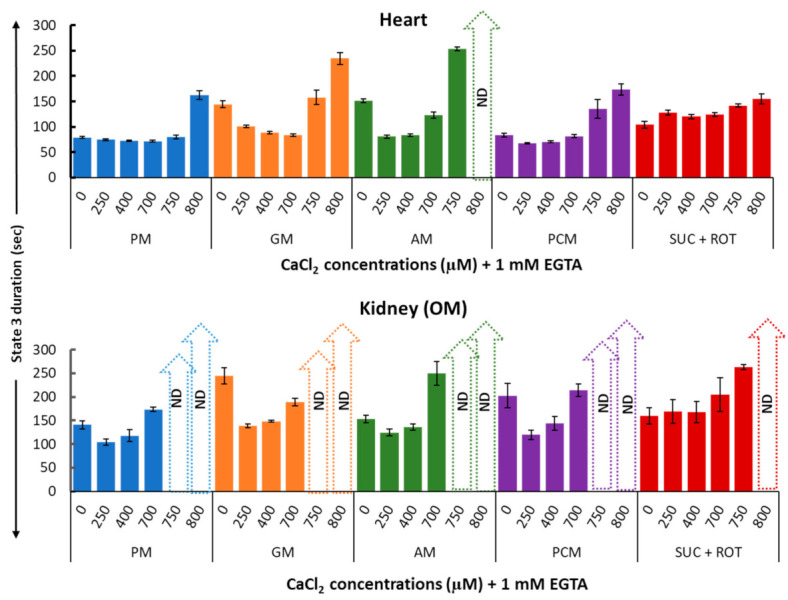
Summary of the different respiratory substrate-dependent effects of Ca2+ on the heart (upper panel) and kidney OM (lower panel) mitochondrial state 3 duration of OCR. The X-axis shows CaCl2 added to the buffer in the presence of 1 mM Ca2+ chelator EGTA. Each bar plot represents the mean value ± SEM (n = 4–6) of state 3 durations of OCR. ND: not determined.