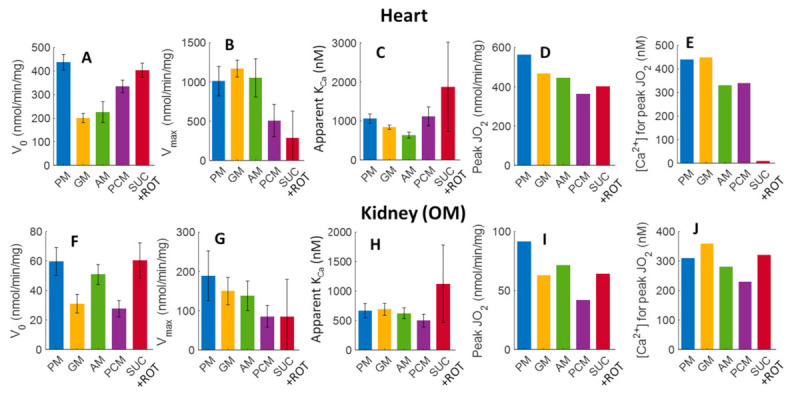
Figure 9.

Estimated values of V0, Vmax, apparent KCa, peak Ca2+ stimulated state 3 JO2, and [Ca2+]free required for achieving the peak Ca2+ stimulated state 3 JO2, and their corresponding 95% confidence intervals obtained based on the nonlinear regression (fitting) of Equation (1) and the state 3 JO2 data from Figure 5. Bar plots in the upper panels (A–E) and bottom panels (F–J) represent the parameters for the heart and kidney OM mitochondria, respectively, for different respiratory substrates (PM, GM, AM, PCM, and SUC + ROT). The peak Ca2+ stimulated state 3 JO2 (D,I) and [Ca2+]free required for achieving the Ca2+ peak stimulated state 3 JO2 (E,J) for each substrate and tissue was predicted by the fitting.
