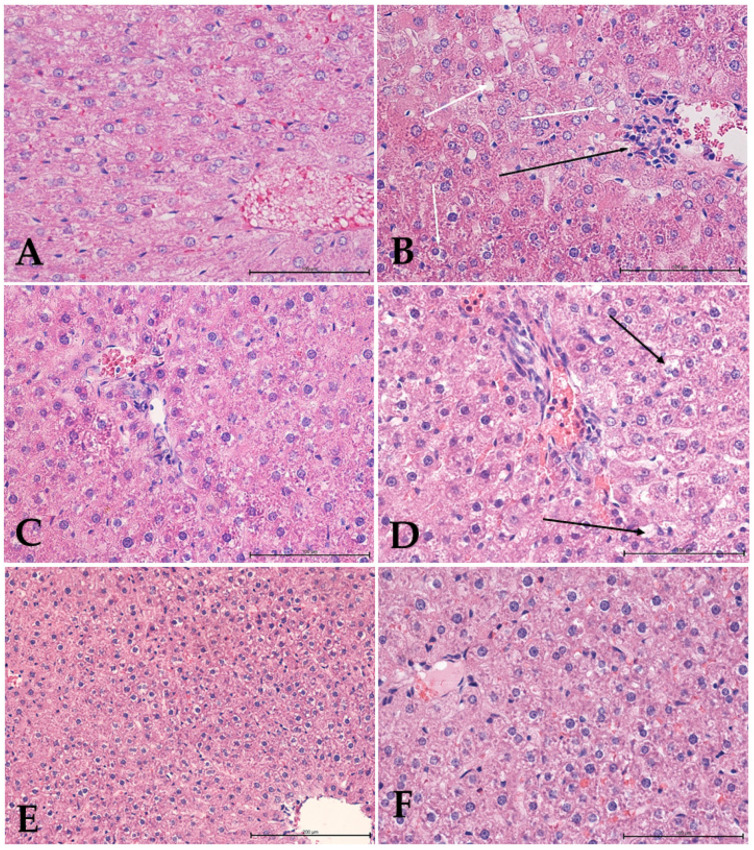
Figure 5.
Histological examination of rat livers stained with hematoxylin and eosin (H&E). (A) Control group, showing liver tissue with normal architecture; (B) high-cholesterol group, showing hepatocytes with intracytoplasmic fat vacuoles (white arrows), small lymphatic infiltration around the liver vessels (black arrow) and numerous binuclear hepatocytes; (C) Ilex group, showing liver tissue with normal architecture; (D) terpenoids group, showing numerous hepatocytes with changes within the cytoplasm (black arrows); (E,F) high-cholesterol with terpenoids group, showing normal liver structure with increased content of fat droplets in hepatocytes. Mag. 400×. Bar scale 100 µm (A–D,F); Mag. 200×. bar scale 200 µm (E).

