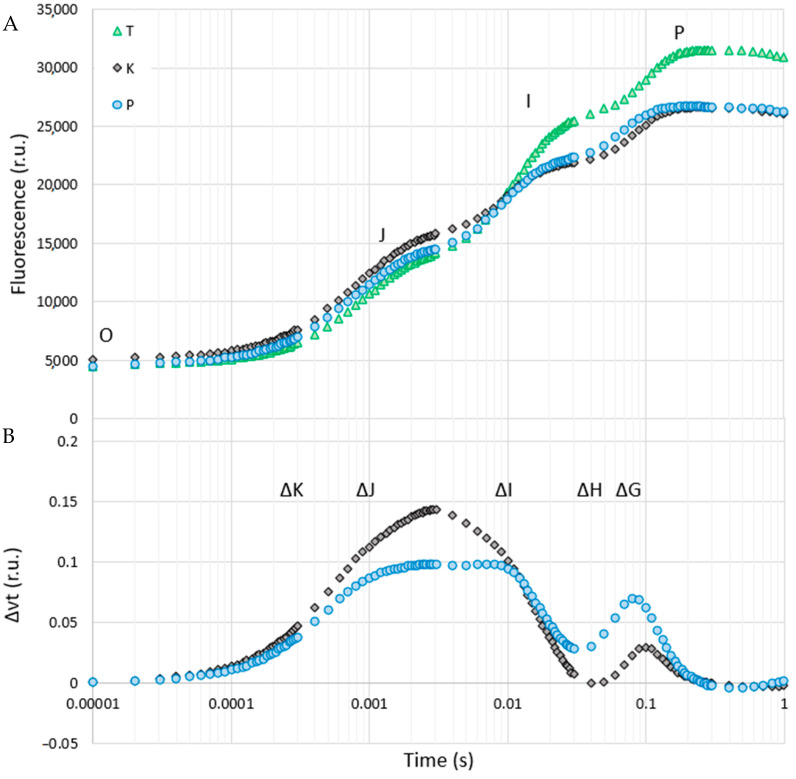
Figure 2.
Chlorophyll a fluorescence induction curves of the silver birch (Betula pendula) from various sites (A) and differences between the populations studied on the relative variable fluorescence (ΔVt = ((Ft − F0)/Fv) − Vt_control) (B). For ΔVt analysis, the fluorescence of trees from Tychy was the reference and was equal to 0. Values are means (n = 10). Abbreviations: T—reference population from Tychy; K—birch population from post-coal mine spoil heap; P—birch population from post-smelter spoil heap; O, J, I, P—points characterising the course of the fluorescence curve, including the minimum and maximum chlorophyll fluorescence for a given population. ΔK—peak informing about the potential damage of the Oxygen-Evolving Complex; ΔJ—peak describing the level of potential damage of the ubiquinone pool; ΔI—peak corresponding to the accumulation of reduced primary quinone; ΔH and ΔG—peaks describing a decrease in activity of the final electron acceptors in PSI, r.u.—relative units.

