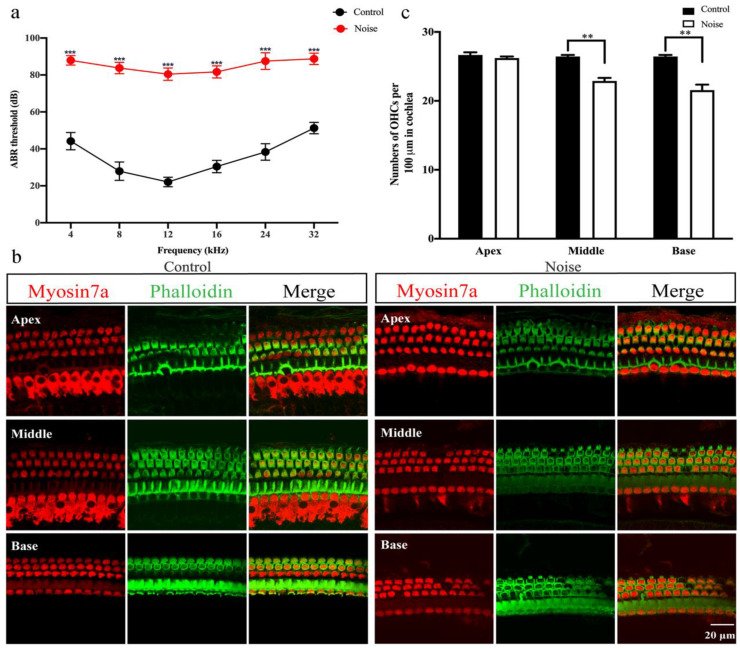
Figure 2.
Noise-induced hearing loss (NIHL) mouse model was constructed under 120 dB SPL for 4 h condition. (a) Comparison of mean auditory brainstem response (ABR) thresholds at frequencies of 4, 8, 12, 16, 24 and 32 kHz between the control group (n = 18) and noise group (n = 18). (b) Myosin7a (red) and phalloidin (green) immunofluorescence staining of mice cochleae in the control group (n = 3) and noise group (n = 3). (c) Quantification of outer hair cells (OHCs) in the apex, middle and base segments of cochlea in the control group (n = 3) and noise group (n = 3). Scale bars = 20 μm. Data are represented as mean ± SEM. ** p < 0.01, *** p < 0.001.

