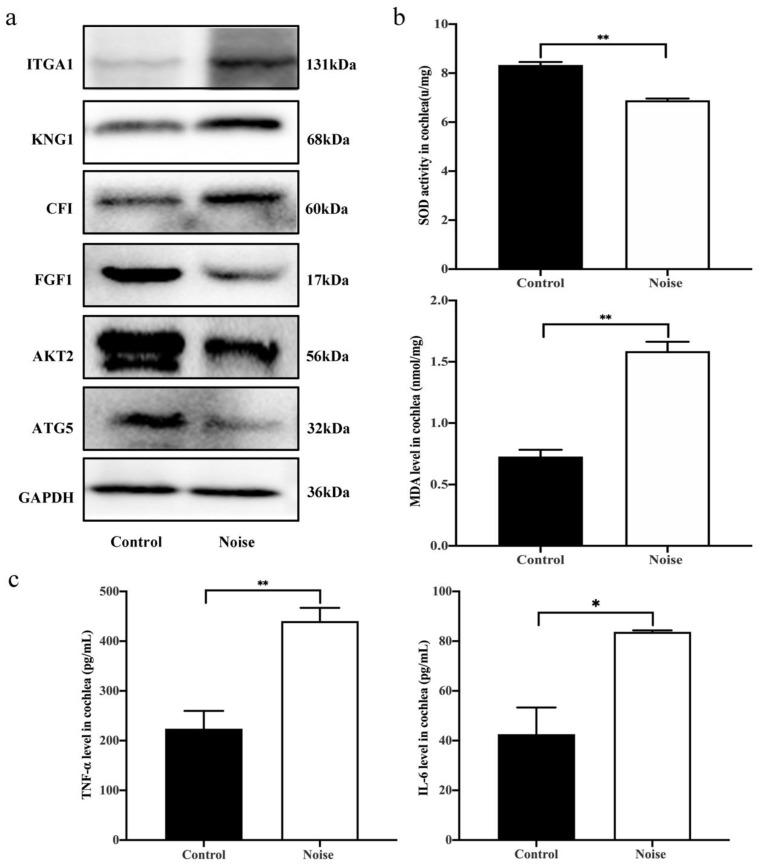
Figure 5.
Measurement of expression levels of DEPs, oxidative stress markers and proinflammatory cytokines production. (a) Validation of representative inflammation and autophagy-related DEPs by western blots in the control group (n = 3) and noise group (n = 3). (b) Comparison of MDA level and SOD activity in cochlea between the control group (n = 3) and noise group (n = 3). (c) Comparison of proinflammatory cytokines TNF-α and IL-6 in cochlea between the control group (n = 3) and noise group (n = 3). Data are represented as mean ± SD. * p < 0.05, ** p < 0.01.

