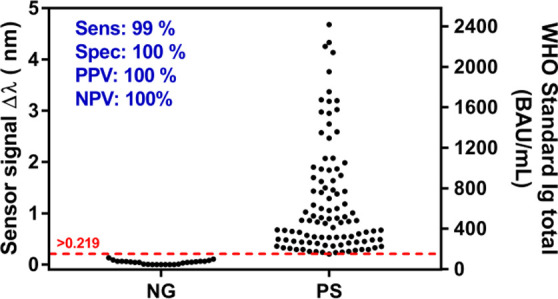
Figure 5.

Sensor signal distribution of 100 COVID-19 positive (PS) and 20 negative (NG) clinical samples. Total Ig concentration calculated from the WHO standard calibration curve is shown in the right axis. Sensitivity, specificity, PPV, NPV, and threshold are also shown.
