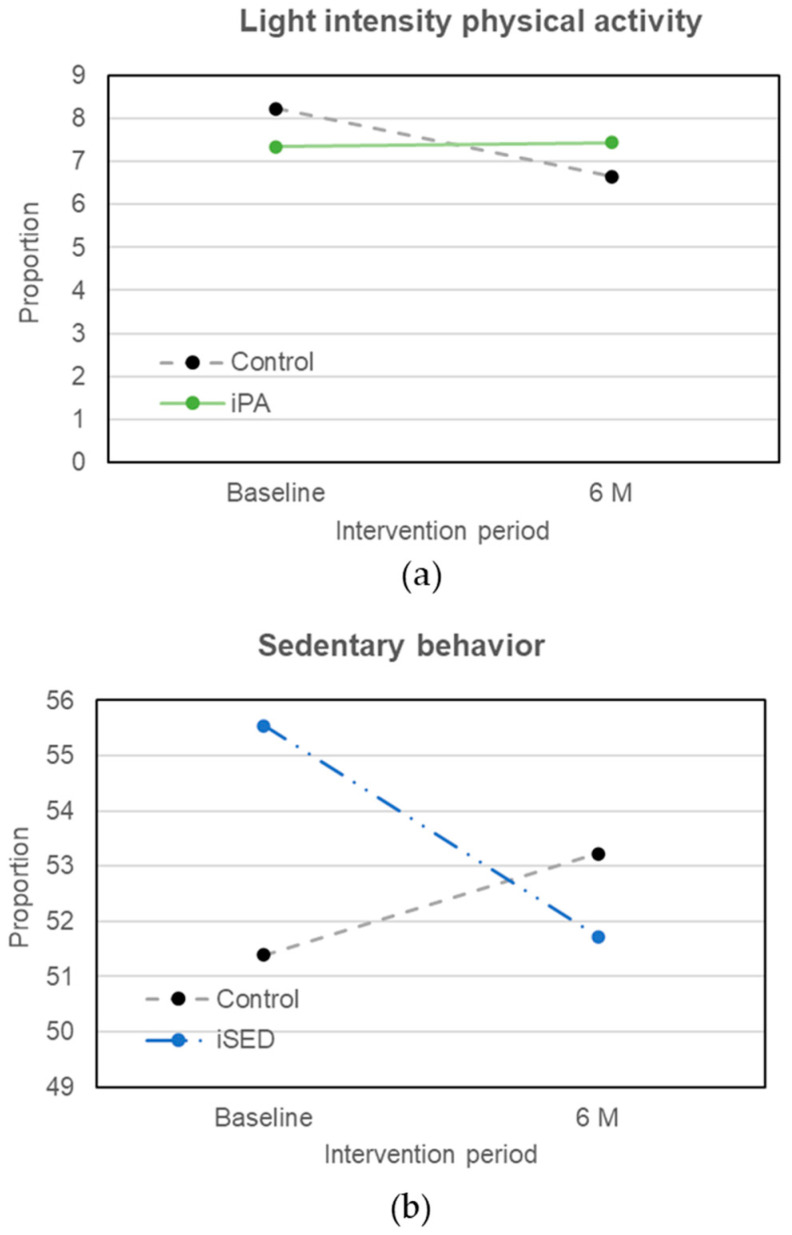
Figure 3.
Intervention effect on physical activity patterns among those with a high executive function and active jobs. Notes: (a) shows changes in light intensity physical activity between control group and intervention group targeting physical activity; (b) shows the changes in sedentary time between control group and intervention group targeting sedentary behavior.

