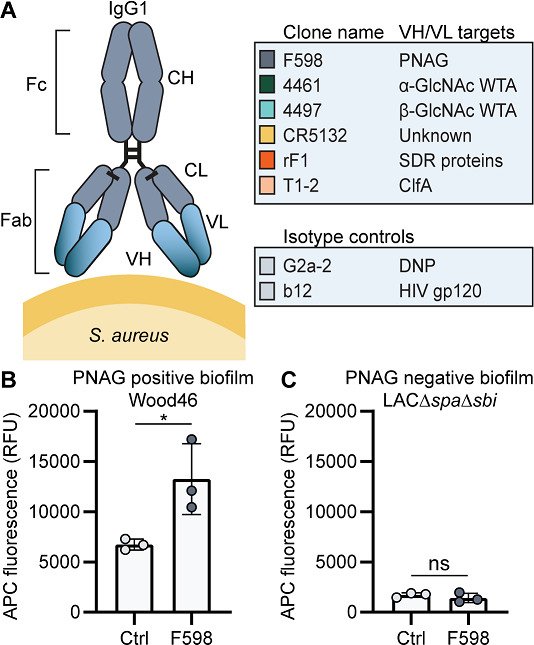
Figure 1. Production of monoclonal antibodies (mAbs) and validation of biofilm.
(A) Human IgG1 antibodies are large (150 kDa) proteins, consisting of two functional domains. The fragment antigen binding (Fab) region confers antigen specificity, while the crystallizable fragment (Fc) region drives interactions with the immune system. Each IgG1 is composed of two identical heavy chains and two identical light chains, which all consist of a constant (CH, CL) and a variable (VH, VL) domain. A panel of six human IgG1 mAbs that recognize polysaccharide and protein components on the cell surface of S. aureus and two nonspecific isotype controls was produced. Variable heavy (VH) and light (VL) chain sequences obtained from different scientific and patent publications were cloned in homemade expression vectors containing human heavy chain (HC) and light chain (LC) constant regions, respectively. (B, C) Biofilms of Wood46 (B) and LAC∆spa∆sbi (C) were grown for 24 hr and incubated with 66 nM F598-IgG1 or ctrl-IgG1 (G2a-2). mAb binding was detected using APC-labeled anti-human IgG antibodies and a plate reader and plotted as fluorescence intensity per well. Data represent mean + SD of three independent experiments. A ratio paired t-test was performed to test for differences in antibody binding versus control and displayed only when significant as *p≤0.05, **p≤0.01, ***p≤0.001, or ****p≤0.0001. Exact p-values are displayed in Supplementary file 2.


