
Figure 7. Localization of [111In]In-4497-IgG1 to a subcutaneous implant pre-colonized with biofilm.
Two days after implantation, mice were injected with 7.5 MBq [111In]In-4497-IgG1 (n = 7) and imaged at 24 hr, 72 hr, and 120 hr after injection. (A) Maximum intensity projection (corrected for decay) of a mouse subcutaneously bearing pre-colonized (C; left flank) and sterile (S; right flank) catheter. Additional scans can be seen in the supplementary information (Figure 7—figure supplement 2). (B) The activity detected in regions of interests was expressed as a percentage of total body activity. Each data point represents one mouse. A two-tailed paired t-test was performed to test for differences in activity in sterile versus colonized implants displayed as *p≤0.05, **p≤0.01, ***p≤0.001, or ****p≤0.0001. Exact p-values are displayed in Supplementary file 2.
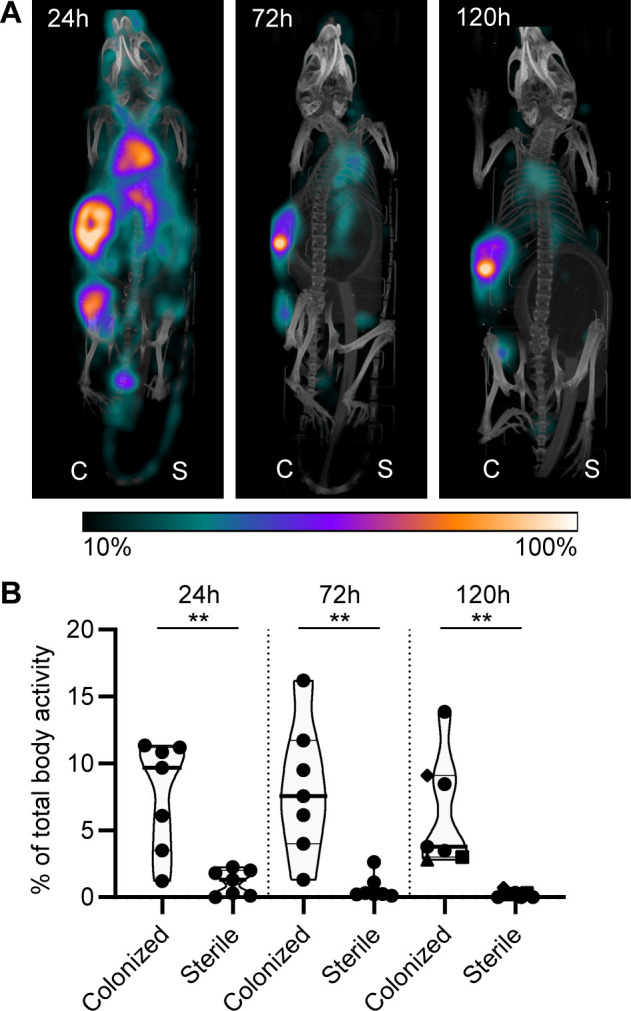
Figure 7—figure supplement 1. CFU count before implantation and after implantation.
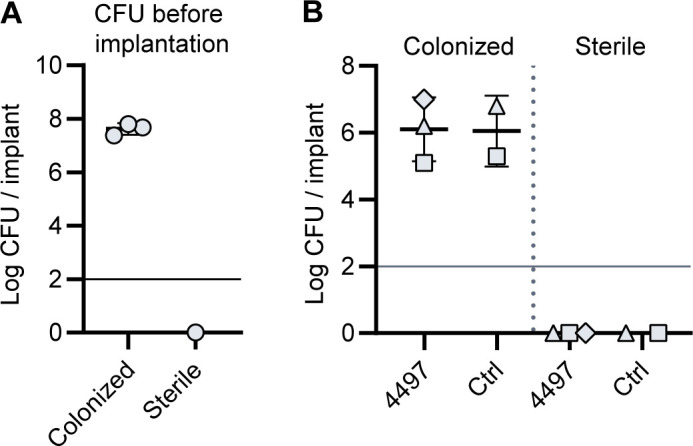
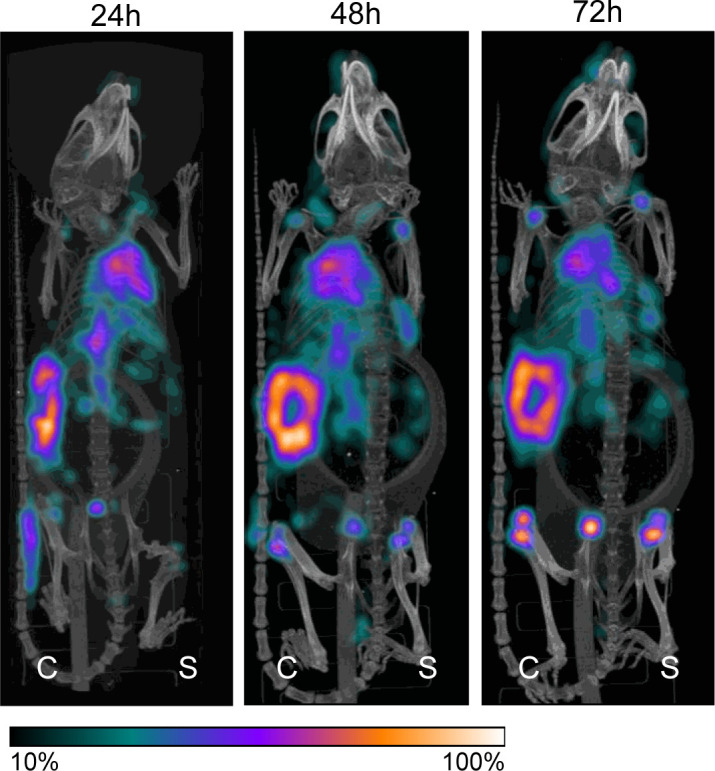
Figure 7—figure supplement 2. Localization of [111In]In-4497-IgG1 to subcutaneous implant pre-colonized with biofilm in a mouse model.

Figure 7—figure supplement 3. Localization of [111In]In-palivizumab to a subcutaneous implant pre-colonized with biofilm.

Figure 7—figure supplement 4. Pilot study for localization of [111In]In-4497-IgG1 to subcutaneous implant-associated biofilm in a mouse model.