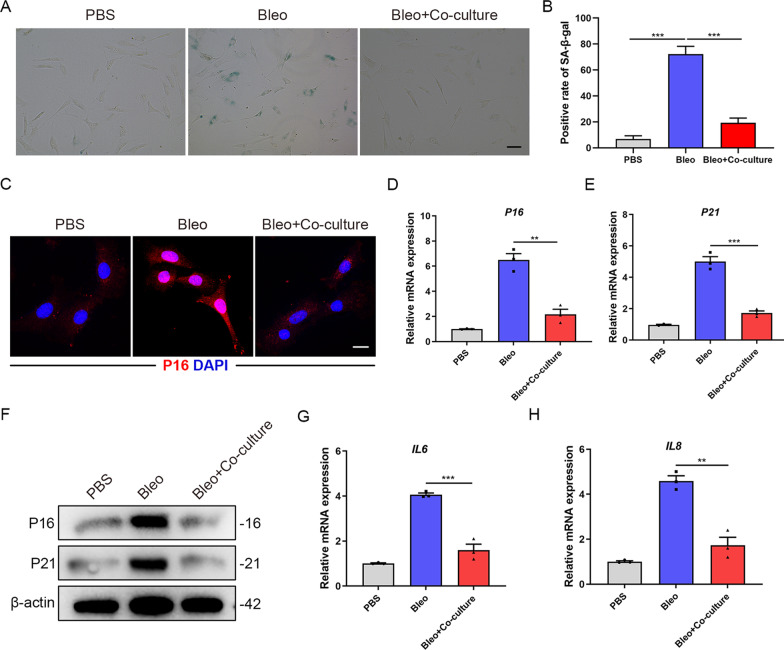
Fig. 3.
AT2 cells co-cultured with MSCs decreases senescent markers. A SA-β-galactosidase staining of primary AT2 cells co-cultured with MSCs. B Quantification of the percentage of β-galactosidase positive cells from A. C Immunofluorescence staining of primary AT2 cells co-cultured with MSCs and visualized using anti-P16 (red) antibody. Scale bars: 10 µm. D qPCR analysis of P16 mRNA expression in primary AT2 cells co-cultured with MSCs. E qPCR analysis of P21 mRNA expression in primary AT2 cells co-cultured with MSCs. F Western blot analysis of P16 and P21 expression in primary AT2 cells co-cultured with MSCs. G qPCR analysis of IL6 mRNA expression in primary AT2 cells co-cultured with MSCs. H qPCR analysis of IL8 mRNA expression in primary AT2 cells co-cultured with MSCs. Data are presented as the mean ± SEM of three independent experiments; **P < 0.01, ***P < 0.001; one-way ANOVA and Tukey’s multiple comparisons test

