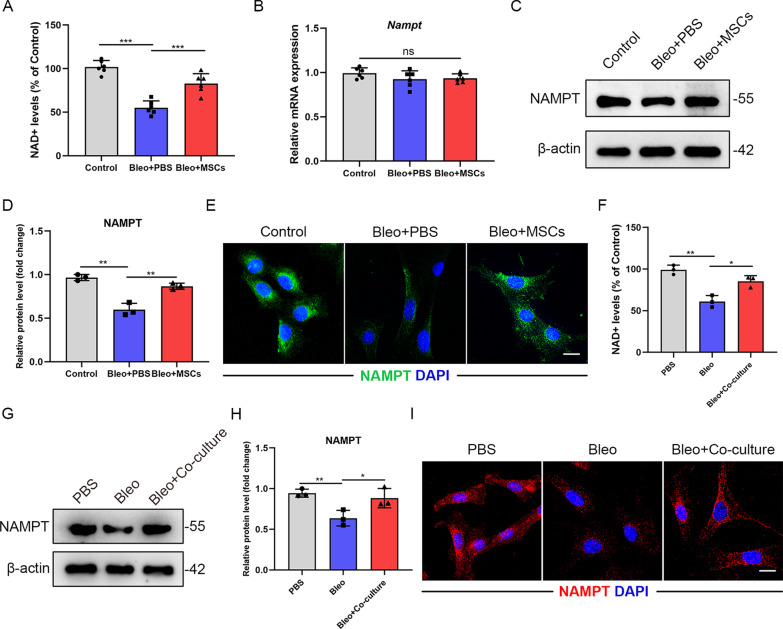
Fig. 4.
NAD+ and NAMPT levels are restored in AT2 cells co-cultured with MSCs. A NAD+ levels (% of Control) of primary AT2 cells from mice of the different groups (n = 6 mice per group). B qPCR analysis of Nampt mRNA expression in primary AT2 cells from mice of the different groups (n = 6 mice per group). C Western blot analysis and D quantification of NAMPT expression in primary AT2 cells from mice of the different groups. E Immunofluorescence staining of primary AT2 cells from mice of the different groups and visualized using anti-NAMPT (green) antibody (n = 6 mice per group). Scale bars: 10 µm. F NAD+ levels (% of Control) of primary AT2 cells co-cultured with MSCs. G Western blot analysis and H quantification of NAMPT expression in primary AT2 cells co-cultured with MSCs. I Immunofluorescence staining of primary AT2 cells from mice of the different groups and visualized using anti-NAMPT (red) antibody. Scale bars: 10 µm. Data are presented as the mean ± SEM of three independent experiments; *P < 0.05, **P < 0.01, ***P < 0.001; one-way ANOVA and Tukey’s multiple comparisons test

