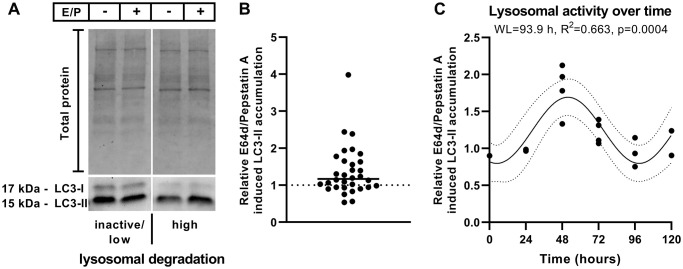
Figure 1.
Relative E64d/pepstatin A-induced LC3-II accumulation. (A) Representative western blot of LC3-I and LC3-II levels in polarized ARPE-19 cells left untreated or treated for 3 hours with lysosomal inhibitors (10 μg/ml E64d + 10 μg/ml pepstatin A [E/P]). (B) Relative E64d/pepstatin A-induced LC3-II accumulation in different batches of polarized ARPE-19 cells treated on different days. n = 32 + median. (C) Overlay of relative E64d/pepstatin A-induced LC3-II accumulation within 72 hours of 4 different cell batches using the highest value as a reference point. Sine waves with nonzero baseline + confidence bands were generated with a comparison of fits (amplitude = 0 versus amplitude unconstrained). Abbreviation: WL: wavelength. Western blot images are cropped showing areas of marked primary antibody interaction only.

