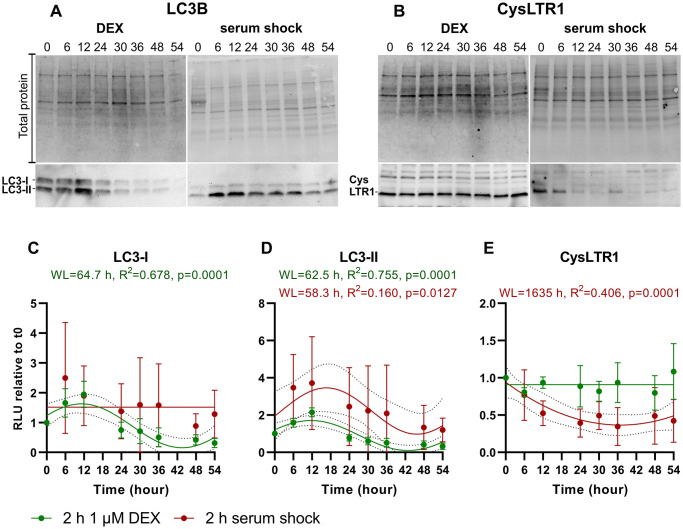
Figure 5.
Time series of LC3-I, LC3-II and CysLTR1 protein expression upon DEX treatment and serum shock in polarized ARPE-19 cells over a 54-hour period measured every 6 hours. Representative western blot analysis showing total protein loading, (A) LC3-I and LC3-II and (B) CysLTR1 expression upon DEX treatment and serum shock in polarized ARPE-19 cells within 54 hours. RLU levels of (C) LC3-I, (D) LC3-II and (E) CysLTR1 upon DEX treatment (green) and serum shock (red) in polarized ARPE-19 cells within 54 hours. Values are represented as the mean ± SD; n = 3–5. Sine waves with nonzero baselines + confidence bands were generated with a comparison of fits (amplitude = 0 versus amplitude unconstrained). Abbreviation: WL: wavelength. Western blot images are cropped showing areas of marked primary antibody interaction only.

