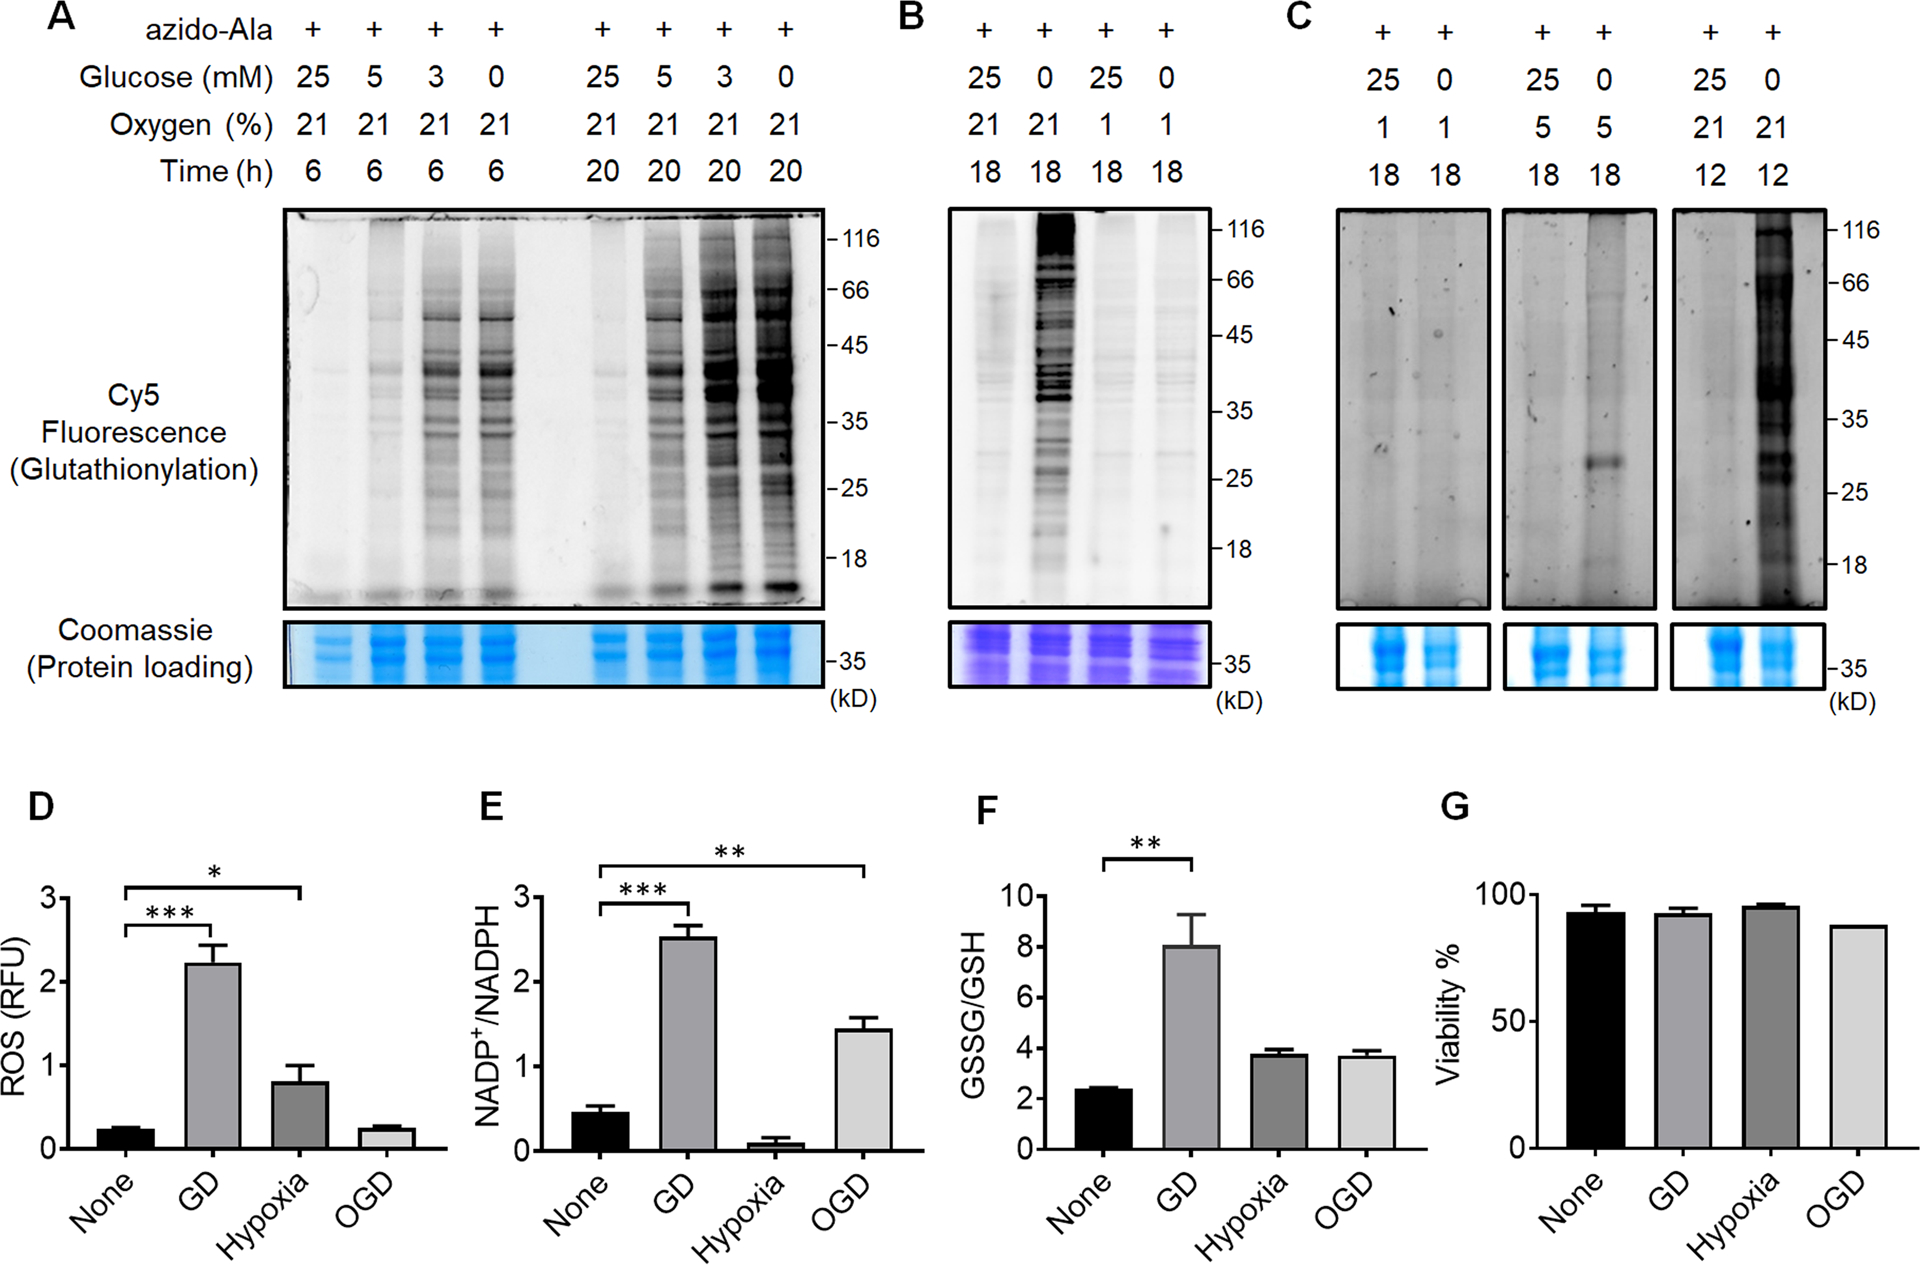
Figure 2. Global protein glutathionylation is significantly induced upon glucose deprivation (GD) but relatively weak in hypoxia or oxygen-glucose deprivation (OGD).

(A-C) Analysis of protein glutathionylation under GD, hypoxia, or OGD. HL-1 cells expressing GS M4 were incubated with azido-Ala. Cells were then subjected to decreasing concentrations of glucose (0–25 mM) under normoxia (A), glucose deprivation in comparison to hypoxia and OGD (B), or glucose deprivation in different percentages of oxygen (1, 5, 21%) (C). After the stimulus, cells were lysed and subjected to click reaction with Cy5-alkyne and analyzed for fluorescence (glutathionylation level) and Coomassie stains (protein loading control). Data are representative of at least 3 independent experiments. (D-G) Analysis of redox environment under GD, hypoxia, or OGD. HL-1 cells were independently analyzed, without using the clickable glutathione approach, for ROS (D), a ratio of NADP+ over NADPH (E), a ratio of oxidized glutathione (GSSG) over reduced glutathione (GSH) (F), and viability (G) after subjecting cells in GD, hypoxia, or OGD for 18 h. Data represent the mean ± SD, n = 3 independent experiments. Difference is significant by one-way ANOVA followed by Tukey’s post-hoc test, *p < 0.05, **p < 0.01, ***p < 0.001.
